COMP1730 Programming for Scientists Assignment Sample
Assignment Brief
The overall aim of this programming assignment is to develop a library of Python functions to handle genetic variation data and predict mutations that may cause genetic disease. You will use these functions to help predict patients with disease-causing genetic variation. You will i) read genetic variation information from Variant Call Format (VCF) files, ii) develop tools to predict the functional outcomes of individual variants, iii) classify individuals into healthy/unwell categories from their genome data alone, and iv) score the mutational burden across local networks of interacting genes, for a single input genome.
Tasks
Task 1
Develop a function to read an individual VCF file. Name the function parse_vcf(). This function takes as input the full file path and name of a single input VCF file and works through each line to parse the information contained therein. You should ignore the description and header lines in the input VCF file (ie. lines beginning with either ‘##’ or ‘#’). This function will return a list of lists. The top-level list will contain sub-lists that each contain the information describing a single genetic variant (a single VCF line) and will contain the following information in each list element, in order (please pay attention to the variable types for each stored value, and cast these to the correct type where necessary):
[0] - chromosome identifier, eg: chr12, type:str
[1] - position, eg: 111425402, type:int
[2] – gene (name of the gene), type:str
[3] – AF (Allele Frequency), eg: 6.56918e-06, type:float
[4] - phenotypic (an annotation of 0 or 1, convert to a boolean value, this field describes whether a mutation is this gene has previously been observed to produce a mutant phenotype or genetic disease), type:bool
[5] - functional_constraint_bin (integer decile bin categories from 0 to 9. These values categorise genes on a scale from essential (0) to redundant (9)), type:int
[6] - CADD_score (variant damage prediction from CADD, >= 20 is damaging), type:float
[7] - PolyPhen (variant damage prediction from PolyPhen, >= 0.85 is damaging), type:float (note - you will need to extract the float value from the text for this field)
[8] - SIFT (variant damage prediction from SIFT, <= 0.05 is damaging),type:float (note - you will need to extract the float value from the text for this field)
[9]- PrimateAI (variant damage prediction from PrimateAI, >= 0.7 is damaging), type:float
Task 2
The American College of Medical Genetics guidelines for evaluating whether an observed genetic variant is likely to contribute to a genetic disease provide some simple rules for prioritising disease-associated variants from a personal genome. These guidelines (among other things) focus on:
• allele frequency
• whether a gene is phenotype-associated (basically, disease-associated)
• whether a gene is essential
• model predictions of mutation effect
In this task, you will implement a function named disease_variant_score() that will take a number of variant annotations as input and return a score calculated with the equation below. This score will be used in Tasks 3 & 4 to rank and filter genetic variants. Here we will impute the effect of a given genetic variant with a linear regression model: y = b1*(1 – AF) + b2*(10 – functional_constraint_bin) + b3*consensus_score + b4*is_phenotypic where y is the model estimate (which we can call the disease_variant_score) and b1 to b4 are coefficients (provided in the code template function signature). The model features are annotation values you parse (with parse_vcf()) from the input VCF files:
• AF (allele frequency; see Task 1)
• functional_constraint_bin (see Task 1)
• consensus_score (see helper function calculate_consensus_score())
• phenotypic (see Task 1)
Task 3
Assess the likely health effects of genetic variation at a population level. Follow these instructions to implement the basic features of the required functions, but please explore means to better identify and differentiate between healthy and unwell people. This is most relevant when you implement the classify_individual() function described below. You have been provided VCF files from 10 healthy control individuals (files: healthy_control*.vcf) and 10 unwell individuals (files conditionA_patient*.vcf). You are to use the distribution of disease_variant_score values (predicted by the disease_variant_score() function) for all variants in these two population groups to develop a simple statistical Z-score comparison to classify new patients into either healthy or disease patient categories.
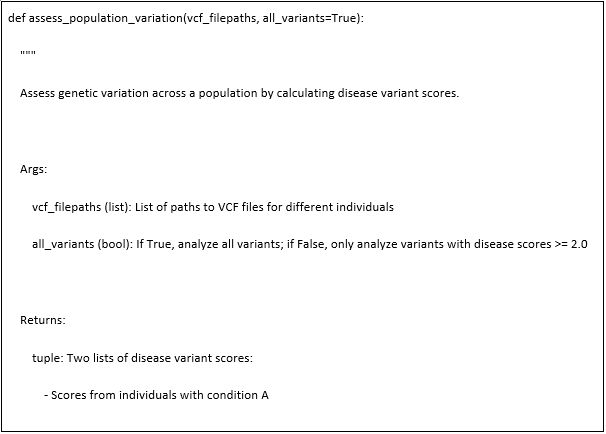
1. Write a function called assess_population_variation(). As input, this takes a list of full-path filenames of the VCF files of the population of interest. For every variant present in the input VCF files, the function will call disease_variant_score() and store the value in a locally-scoped list of float prediction values. The function should also accept a named argument called all_variants, which when has a default value of True, causes the function to return the list of all results from disease_variant_score(). If the all_variants parameter is set to False, the function will return a list only containing the maximum disease_variant_score() result for each individual VCF input file. The logic behind this is that when appraising the VCF file from an unwell individual, almost all of the variation in the genome will be benign, except for the genetic variant (or a small number of variants) causing their sickness. You may also output other variant score sets from assess_population_variation() (ie. other function parameter to derive other variant score sets) if you have further ideas of how to best use this information in the function that follow.
2. Write a function called classify_individual() that takes as input:
i. The VCF file for the genome of the individual we want to classify. This needs to be the full path to a single VCF input file.
ii. The list of float values returned from assess_population_variation(<list of healthy control VCF filenames>, all_variants=True). In place of <list of healthy control VCF filenames> you should provide a list of filenames of all VCF files from healthy control individuals.
iii. The list of float values returned from assess_population_variation(<list of unwell VCF filenames>, all_variants=False). In place of <list of unwell VCF filenames> you should provide a list of filenames full filepaths) of all VCF files from unwell individuals. With this input, write code in the classify_individual() function to determine the maximum disease_variant_score()score from the input VCF file specified as the first argument above. This will provide a prediction of the most damaging variant identified in the genome of the individual we wish to classify. Then the classify_individual() function will compare this maximum disease_variant_score from our healthy/unwell input VCF file with the two lists of disease_variant_score values provided as arguments 2 and 3. The key idea is to compare the maximum disease_variant_score from our input VCF file with the distributions of the variants from the healthy controls and the worst variants from the unwell patients. To perform the classification, calculate the Z-score of the maximum disease_variant_score with reference to both input distributions, and choose a classification based on the distribution from which the Z- score is lowest. Return your classification as either healthy or disease string values.
For your reference, a Z-score is the difference between a given value and the mean value of an observed distribution, divided by the standard deviation of the observed distribution, thus:
Z = (x – μ)/s
Where, for this example, x is the maximum disease_variant_score from the individual we wish to classify, μ is the mean of either the healthy or unwell disease_variant_score distributions, and s is the standard deviation of the same distribution. You may provide your own implementations of the mean and standard deviation calculations or import the statistics module to do the same. You may not import any other external libraries for this task, including PANDAS, Numpy or SciPy.
Task 4
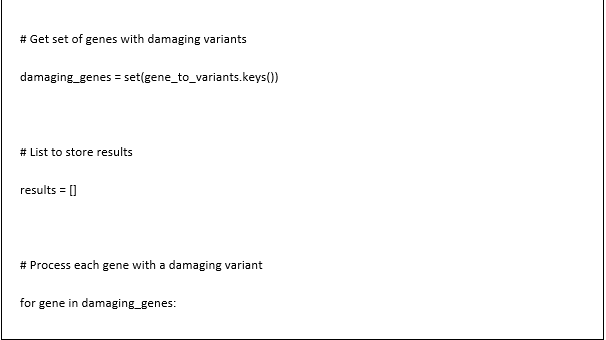
Complex genetic disease is caused by groups of genetic variants that are functionally linked. Implement a function named count_mutation_load() that will use both input data from a VCF file and a representation of a gene interaction network, accessible through the helper function interaction_data() (which has been provided for you already, see assignment template file). From this data, you will work through every gene containing a damaging variant and count the number of other damaging variants in other genes within a specified number of degrees of separation. The output should be a list of lists, ordered by the number of damaging variants associated with the interaction network of each gene. The details of the information contained in each sub-list is described below. This task is divided into the following sub-tasks:
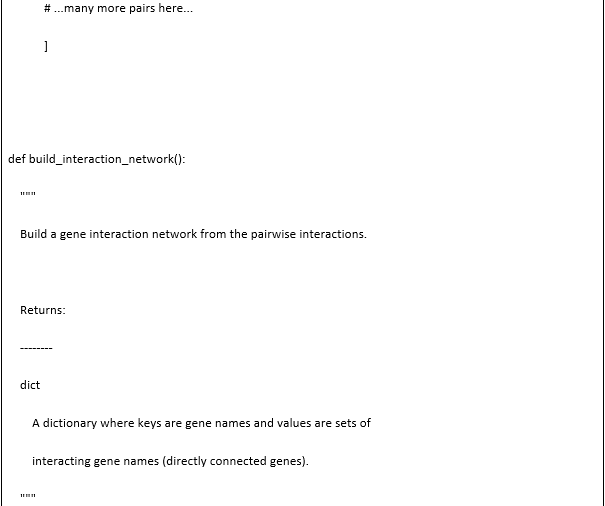
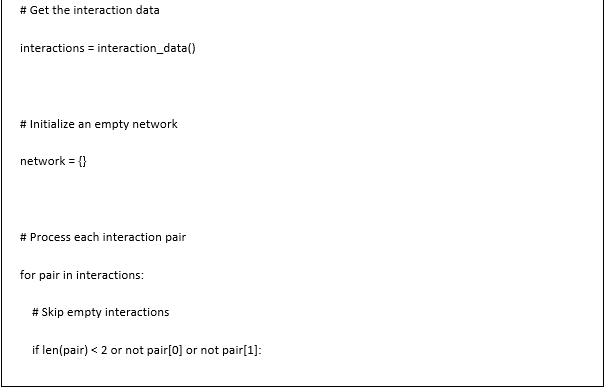
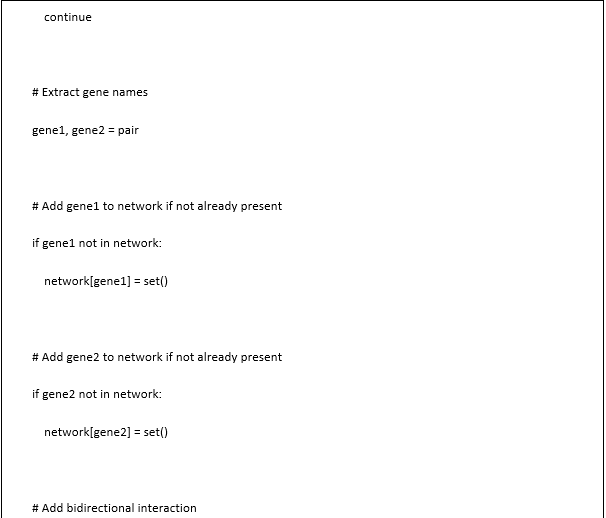
1. A helper function named interaction_data() is defined in the code template file for this assignment. Calling this function returns a list of lists, with each sub-list containing the names of two interacting genes. Implement another function named build_interaction_network() that calls interaction_data() and uses the pairwise interactions to build a data structure that will contain the interaction network for all named genes. Consider all named interactions as bidirectional.
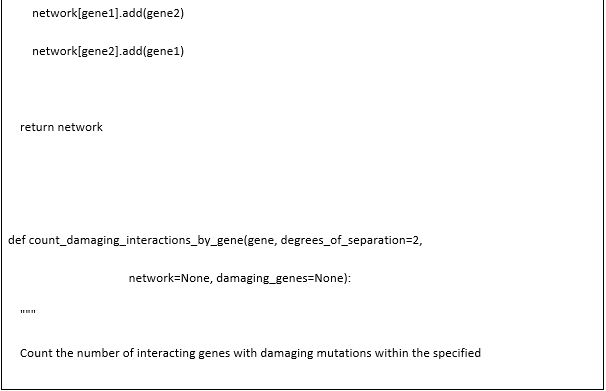
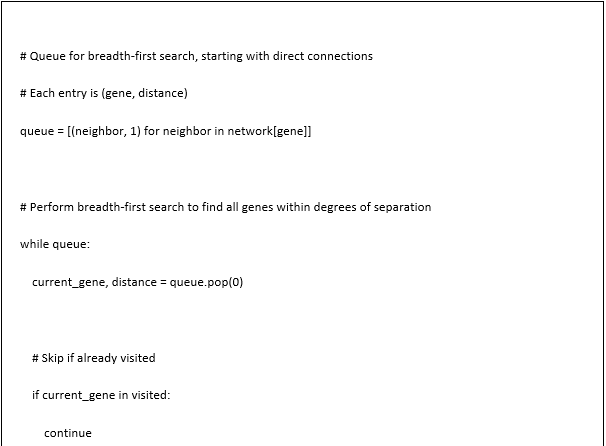
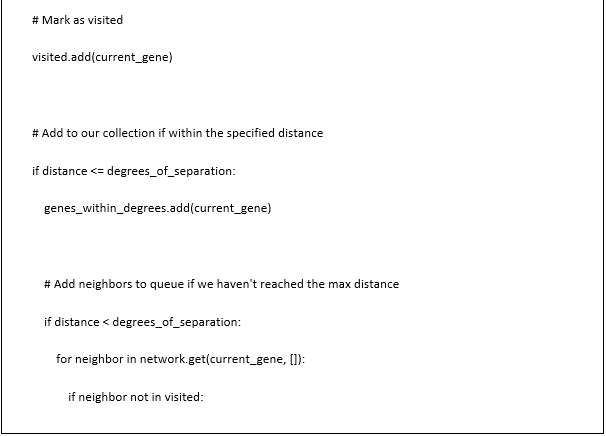
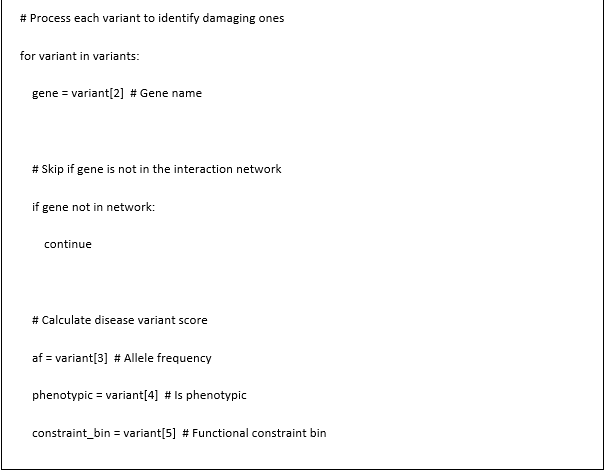
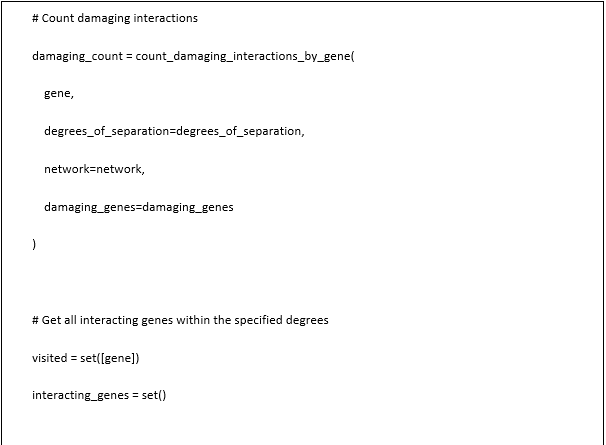
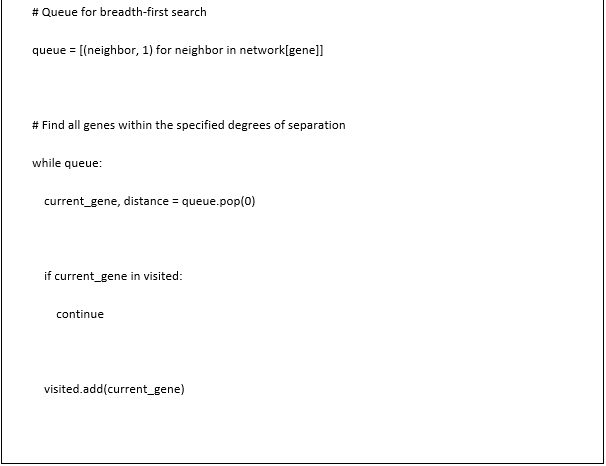
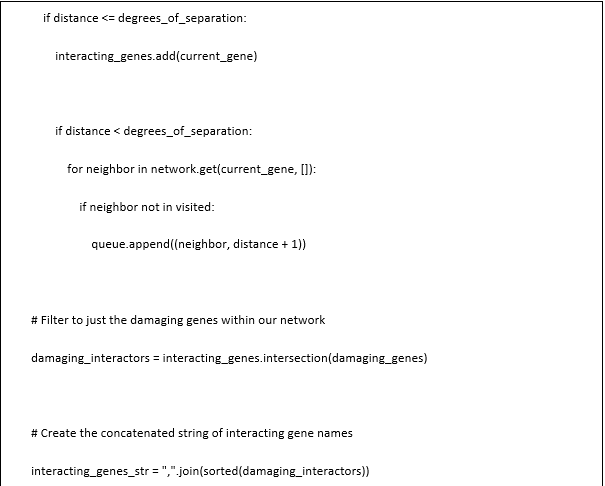
2. Implement a function named count_damaging_interactions_by_gene() that takes named arguments of gene (the name of the gene, type:str) and degrees_of_separation (type:int). By default, please use degrees_of_separation=2. The function takes two optional named arguments, network and damaging_genes. Both arguments allow precomputed information to be passed to the function, to avoid the need to recompute this information for every call. The network argument allows a pre-computed interaction network to be passed in. The damaging_genes argument allows a pre- computed data structure of genes containing a damaging mutation/variant to be passed to the function. The return value of this function will be an integer count of the number of interacting genes containing a deleterious mutation (from the data structure created in build_interaction_network()) within the specified degrees of separation from the central, named gene. Multiple damaging variants in a single gene (if present) should only be counted once. If any gene present in the input VCF file is not also present in the interaction network data, please exclude these genes from further analysis.
3. Write a top-level function named
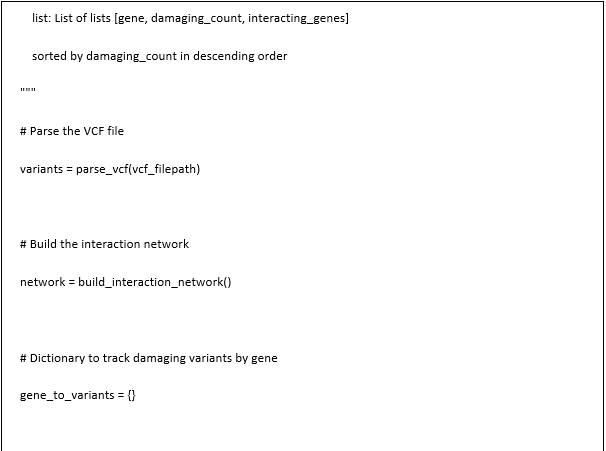
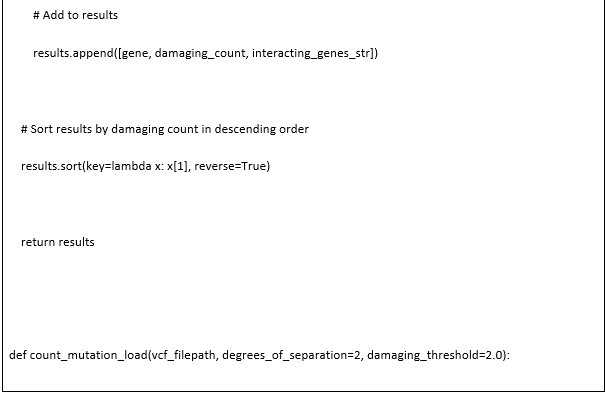
calculate_subnetwork_mutation_burdens(), which will take arguments of a VCF filename and a degrees_of_separation integer value (default=2). This function will iterate through every gene in the input VCF file that contains a damaging variant. For each of these mutated genes, the function will call other functions to count the number of damaging variants within the specified degrees of separation. The function will return a list of lists, ranked in descending order by the mutation count for each central gene. The fields of each sub-list will be:
[0] - Gene
[1] - Damaging mutation count
[2] - Concatenated string of the interacting gene names.
(i.e ‘Dock8,Foxp3,TNFRSF1A’)
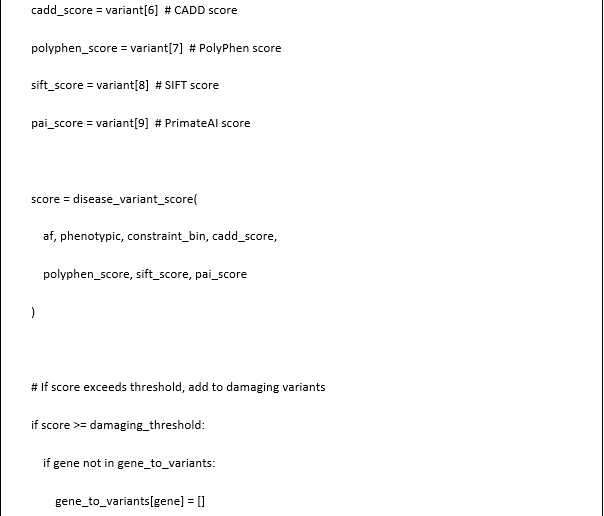
You should also specify a parameter named damaging_threshold to be a cutoff value to differentiate damaging from benign genetic variants. In all cases, use the disease_variant_score value calculated by the disease_variant_score() function as the metric for this threshold.
Solution
Introduction
The steps provided in the current code are a full pipeline that facilitates the processing of VCF files to display genetic mutations in genetic variants analysis. It is a function used to parse VCF files as well as extract genetic variants including chromosome, position, allele frequency, being constrained, and predictive scores inclusive of CADD, PolyPhen, SIFT and PrimateAI. It converts organised but not formatted or normalized data into more suitable format for further analysis. The functions calculate_consensus_score() and disease_variant_score() predict pathogenicity by taking in multiple computational prediction tools as well as genetic parameters and using them to come up with disease risk score. To population analysis, there are two subroutines: assess_population_variation() that categorises people depending on the genetic variability relating to the disease, and classify_individual() that statistically compiles an individual profile against the healthy and affected populations. The reason why such statistical indicators as mean and standard deviations may be used in classifying the for university assignment help confidence level is because they provide a very strong means of comparison. Additionally, the pipeline includes the interaction_data(), build_interaction_network(), and count_damaging_interactions_by_gene() in the advanced configuration for gene interaction network analysis to determine mutations and associated interacting genes in the assigned network. This system, based on computational genomics and use of prognosis from machine learning together with statistics, provides for a powerful system to assess risks of hereditary diseases and propensity of mutations to be pathogenic, and to detect mutation ‘hotspots’ in networks of genes that interact with one another.
Task 1
.png)
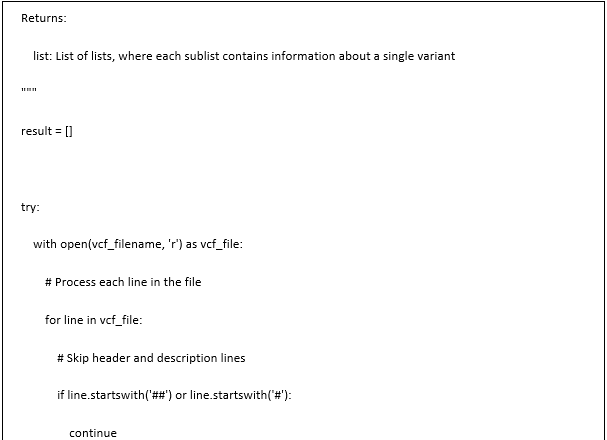
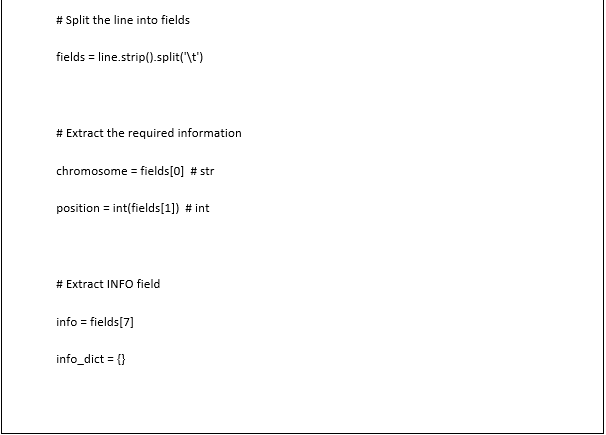
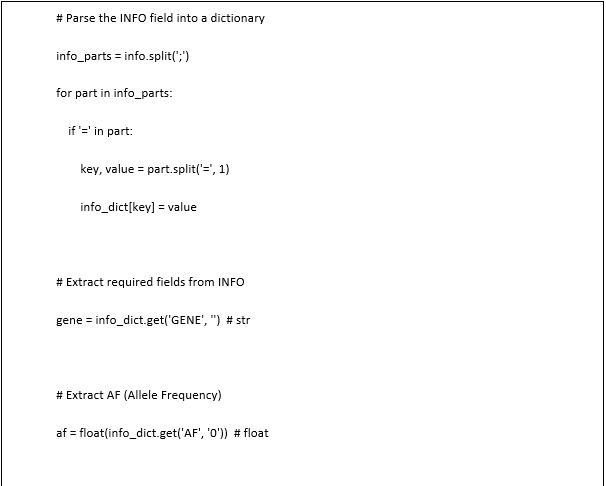
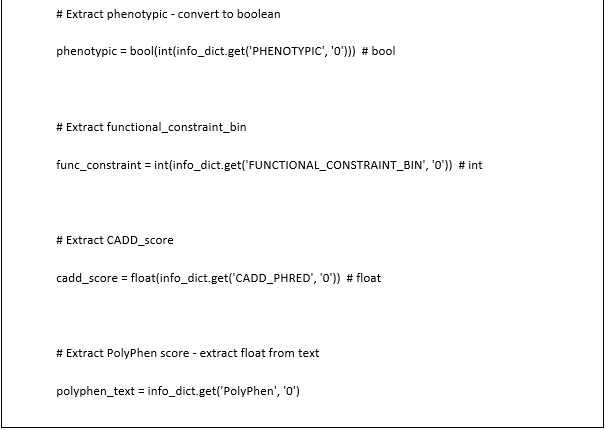
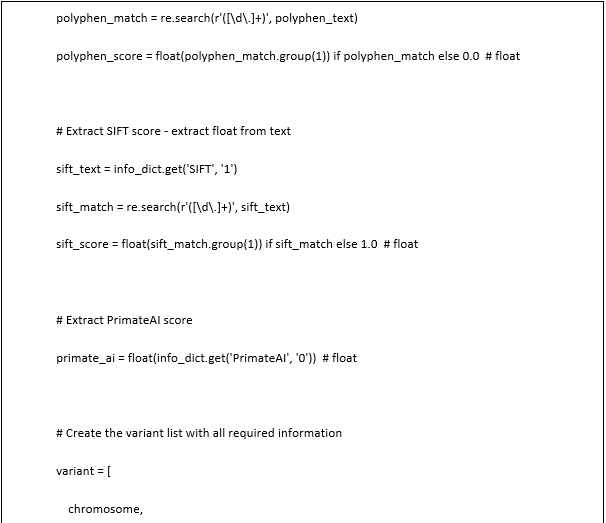
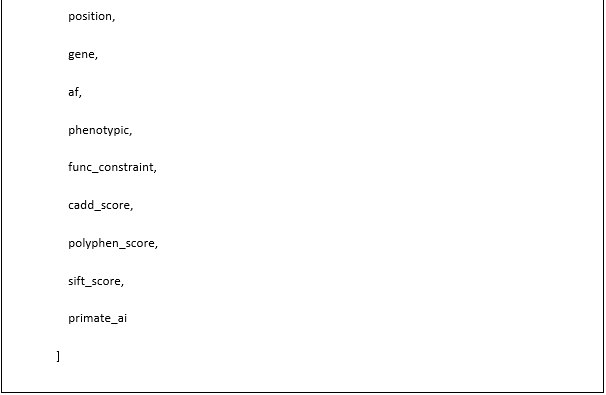
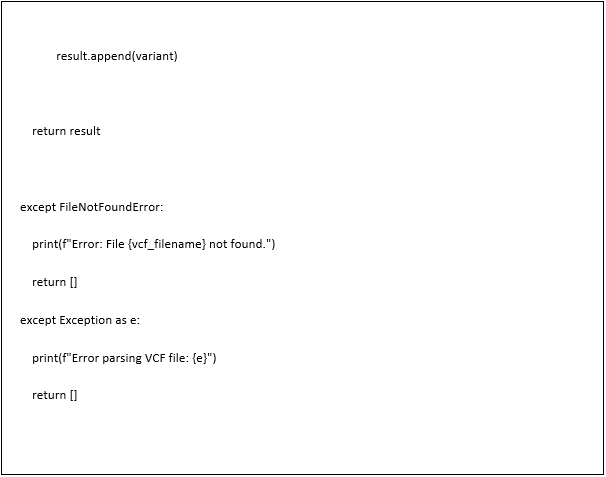
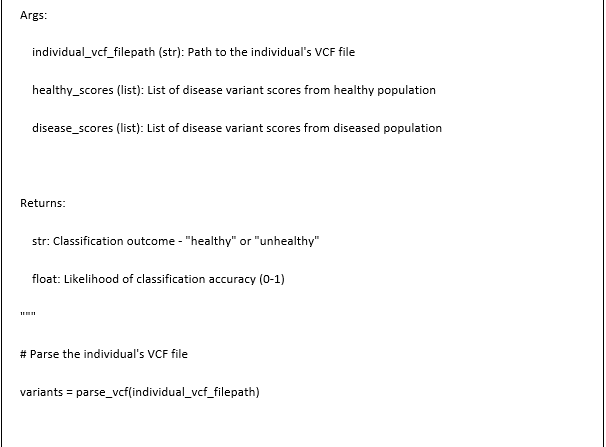
This Python code defines a single function parse_vcf() that processes Variant Call Format (VCF) files used in genomic analysis by extracting specific genetic variant information into a structured format; the function accepts a VCF filename as input and returns a list of variant data where each variant is represented as a list of attributes including chromosome, position, gene name, allele frequency, phenotypic status, functional constraint bin, and various predictive scores (CADD, PolyPhen, SIFT, and PrimateAI); the implementation uses a try-except block for error handling, opening the specified file and iterating through each line while skipping header lines (those starting with '#'); for data lines, it first splits the tab-delimited fields to extract basic information like chromosome and position, then performs a detailed parsing of the INFO field (found at index 7) by splitting it into semicolon-separated parts and creating a dictionary of key-value pairs; the function extracts specific genetic annotations from this dictionary, handling different data types appropriately - converting strings to integers, floats, or booleans as needed - and using regular expressions to extract numerical scores from text fields like PolyPhen and SIFT; the extracted information for each variant is compiled into a standardized list structure and appended to the results collection; error handling includes specific responses for missing files (FileNotFoundError) and general parsing issues (Exception), both returning an empty list while displaying an appropriate error message; the function effectively transforms semi-structured VCF text data into a programmatically accessible format that facilitates downstream genetic analysis; the presence of the statistics import at the top suggests this function might be part of a larger bioinformatics analysis pipeline though the statistics module isn't directly used within this particular function; notably, the code references the re module for regular expression processing but doesn't show its import statement in the provided snippet, indicating this may be a component of a more comprehensive script.
Task 2
.png)
.png)
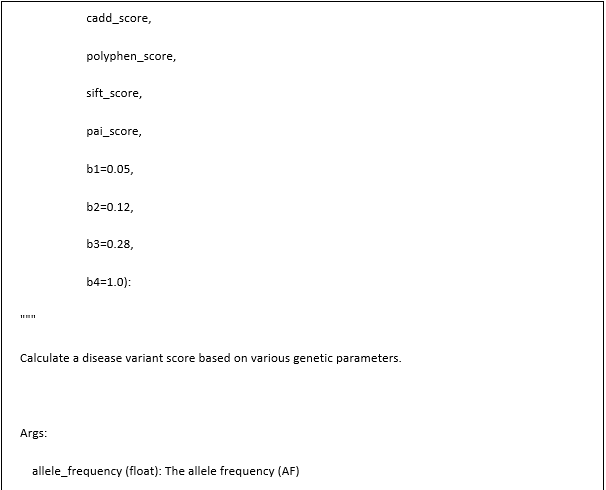
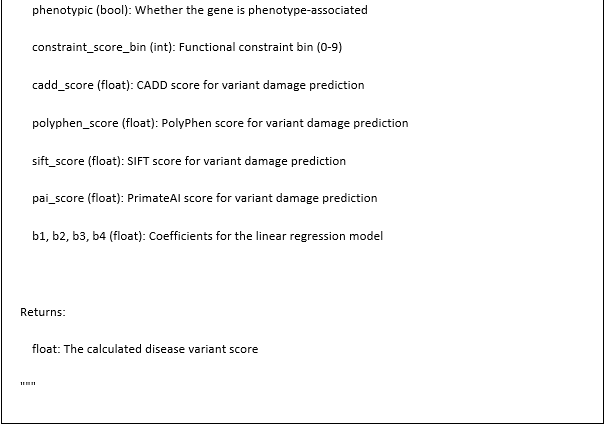
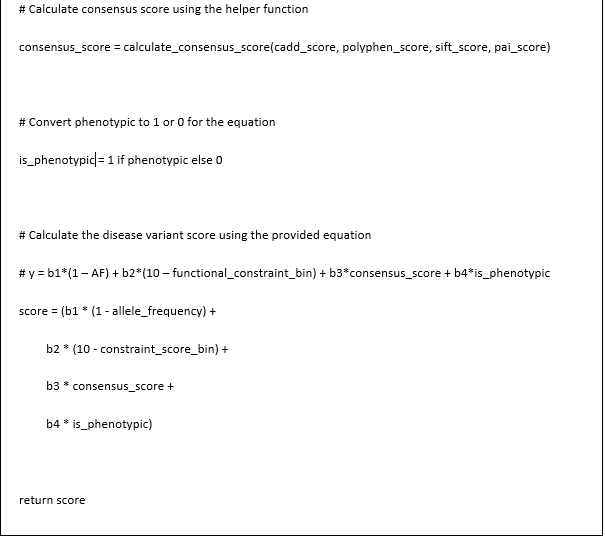
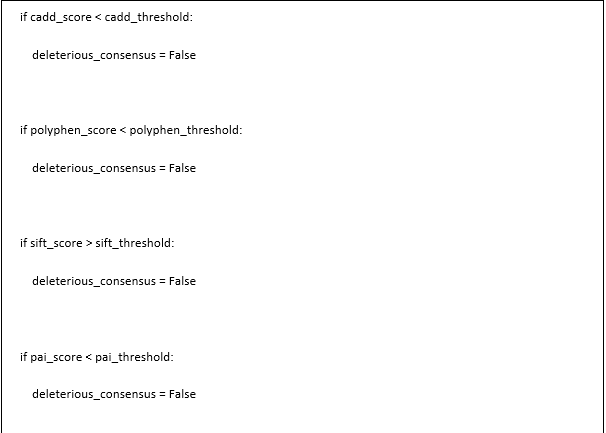
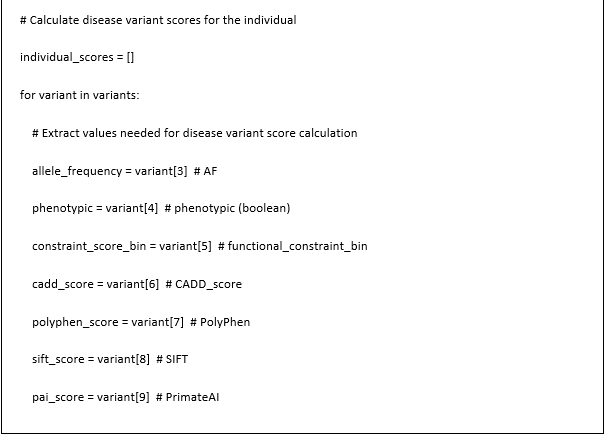
This code segment defines two Python functions for genetic variant analysis: calculate_consensus_score() and disease_variant_score(), which work together to evaluate the potential pathogenicity of genetic variants. The calculate_consensus_score() function serves as a helper that integrates predictions from four different computational tools (CADD, PolyPhen, SIFT, and PrimateAI) to determine if a variant is likely harmful; it accepts scores from each tool along with configurable thresholds for each predictor (defaulting to established values in the field), and implements a two-part scoring system - first determining if all tools agree the variant is deleterious by comparing each score against its respective threshold, then calculating a weighted average of normalized scores where CADD is divided by 35 and SIFT is inverted (since lower SIFT scores indicate deleteriousness, unlike the other metrics); importantly, if all tools agree the variant is harmful, the function triples the consensus score to emphasize this agreement. The main function, disease_variant_score(), calculates an overall pathogenicity score by combining multiple genetic parameters: allele frequency (rarity of the variant), phenotypic association status (whether the gene is linked to disease), functional constraint (how evolutionarily conserved the region is), and the consensus prediction score from the helper function; it implements a weighted linear regression model with four coefficients (b1=0.05, b2=0.12, b3=0.28, b4=1.0 by default) that balance the contribution of each parameter. The disease score is calculated in a specific formula b1 * variant's rarity (minus allele frequency), b2 * inverse constraint bin (10 bin value minus the bin value, bins below 10 indicate higher constraint), b3 * consensus deleteriousness score, b4 * if the gene is associated to phenotypic associations (1 if yes, 0 if no). It provides a high score calculated through population genetics (allele frequency), evolutionary biology (constraint), computational guessing (consensus score), and clinical knowledge (phenotypic associations) for detection of those variants which are most likely to be responsible for disease. The relatively higher weight (b4=1.0) assigned to phenotypic associations indicates this factor's particular importance in determining pathogenicity, while the lowest weight (b1=0.05) for allele frequency suggests it contributes less significantly to the final determination, though rare variants are still favored over common ones in the scoring model.
Task 3
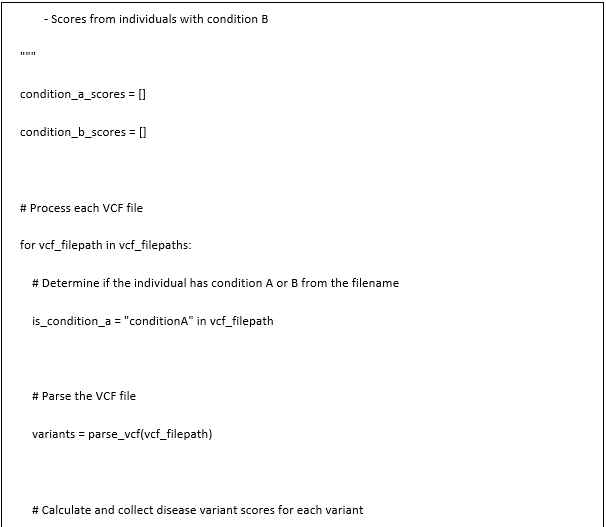
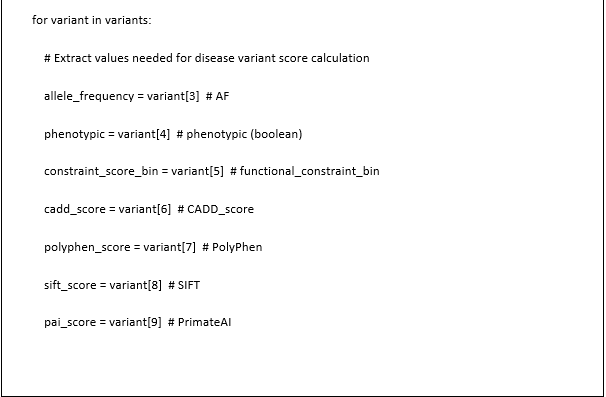
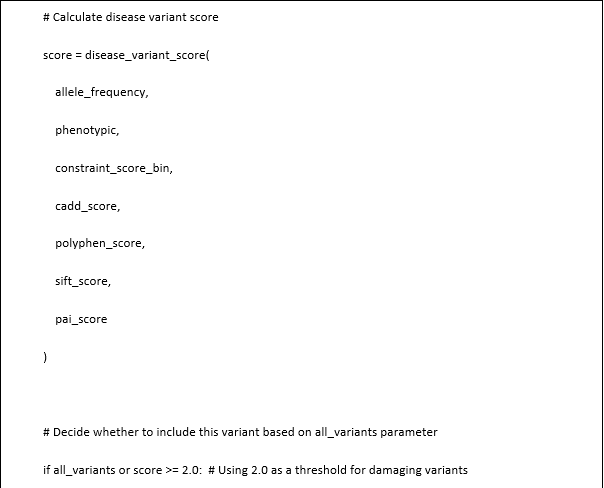
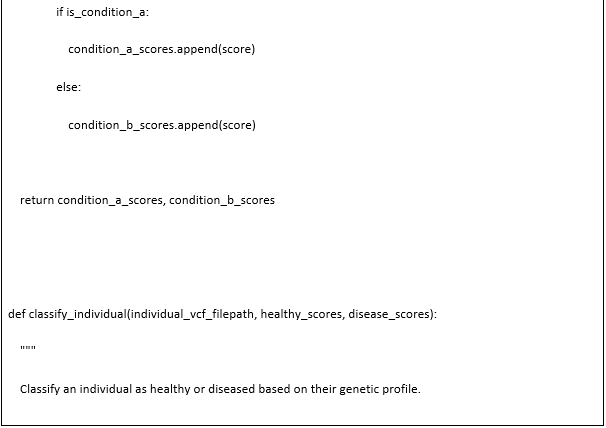
.png)
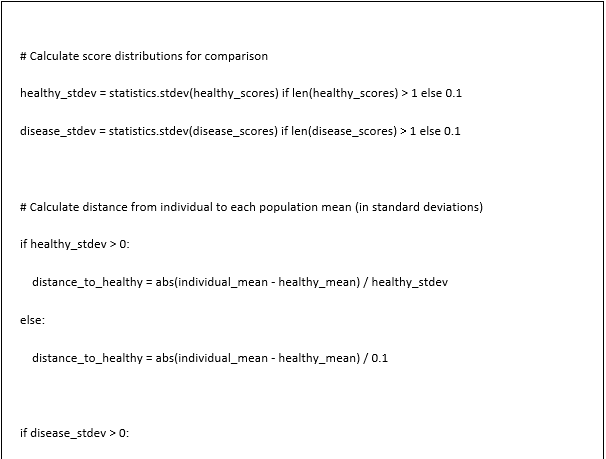
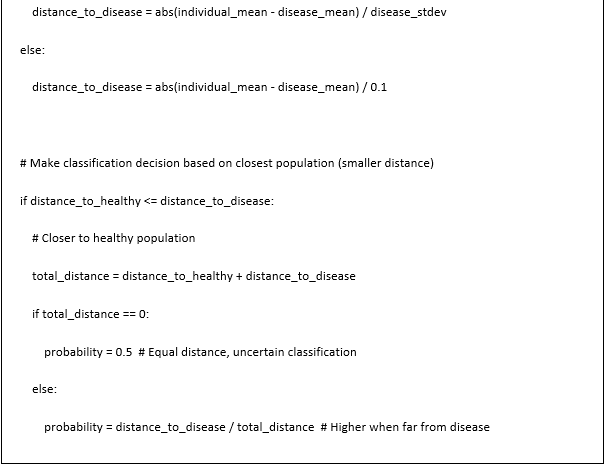
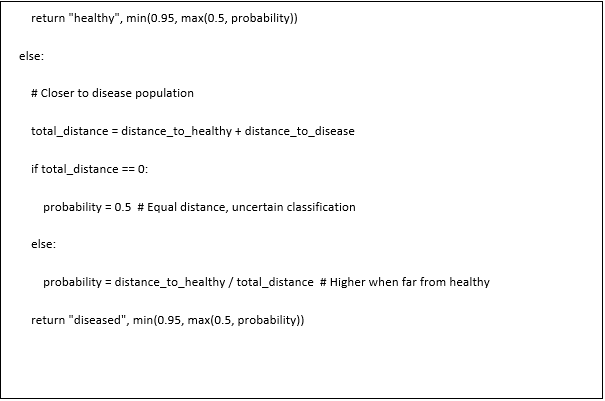
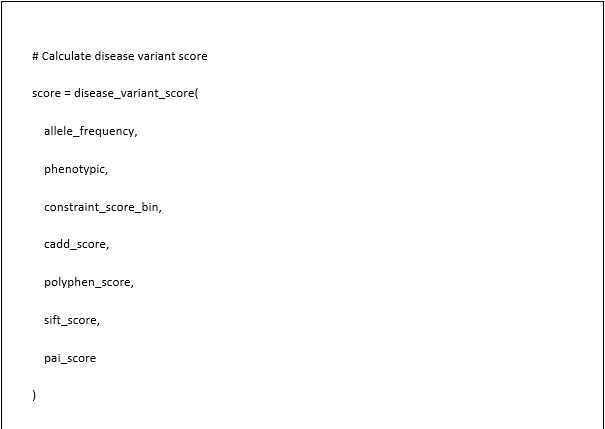
This code implements a genetic variant analysis pipeline with two main functions: assess_population_variation() and classify_individual(). It is noted that ‘assess_population_variation()’ command determines genetic variance across populations. This is done by analysing numerous VCF content, computing disease variant numbers for every individual's genetic difference, and then organising those ratings into two categories based on filename patterns indicating condition A or B. Repeat until desired outcome is reached. By receiving VCF file paths as well as an integer flag, the method may analyse all variations or simply those with sickness ratings higher than 2.0. In order to contrast situations, it generates two scoring lists. The `classify_individual()` function determines whether someone is probably healthy or diseased. It is based on their genetic profile. This function checks the variant score of the given samples against reference populations. Then, it starts parsing the VCF file of that person. It then computes disease variant scores. Only variants with a score equal or higher to a threshold (≥2.0) are considered. Then, it engages in a statistical comparison. Distribution of healthy and diseased population is compared to the individual’s mean score. Standard deviation distances are being used to classify the logic. It helps to decide which population the individual resembles more. Probability calculations reflect classification confidence. Higher probabilities mean greater certainty. The capacities on probabilities range from 0.5 (quite certain) to 0.95 (quite confident). The function handles edge cases. It classifies healthy if it does not find any significant variants, which gives 0.95 probability. For zero standard deviations, 0.1 is used as default. This avoids division errors. Both functions rely on previously defined helper functions: parse_vcf() to extract variant information from VCF files and disease_variant_score() to calculate pathogenicity scores based on multiple genetic parameters (allele frequency, phenotypic association, constraint scores, and damage prediction scores from CADD, PolyPhen, SIFT, and PrimateAI tools). The statistical processing leverages Python's statistics module to calculate means and standard deviations of score distributions. Together, these functions create a computational framework for population-level genetic analysis and individual disease risk assessment, implementing a methodical approach that balances multiple factors in evaluating genetic variants' potential contributions to disease, while incorporating statistical measures to quantify classification confidence.
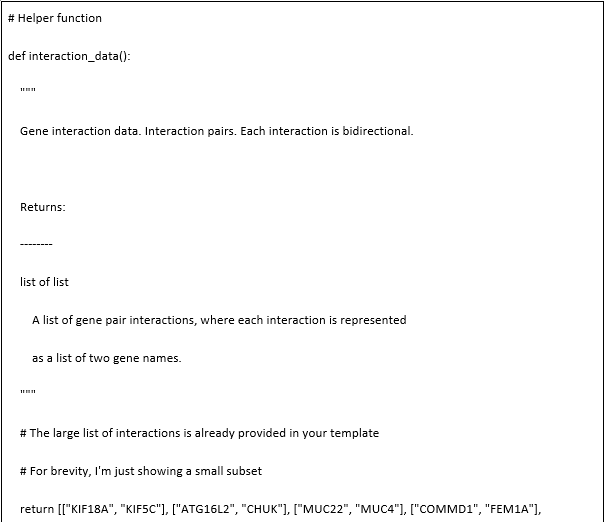
Task 4
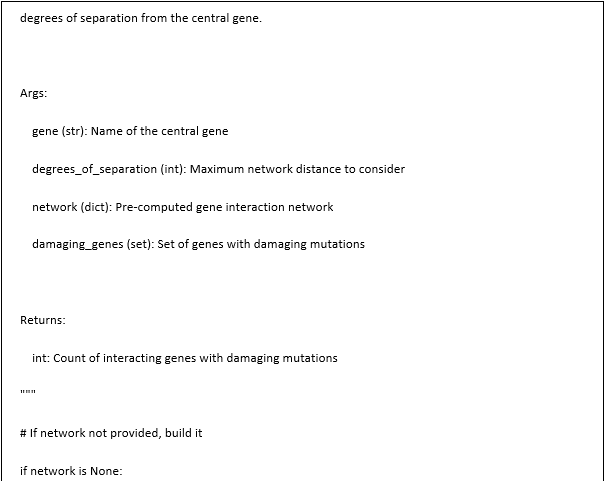
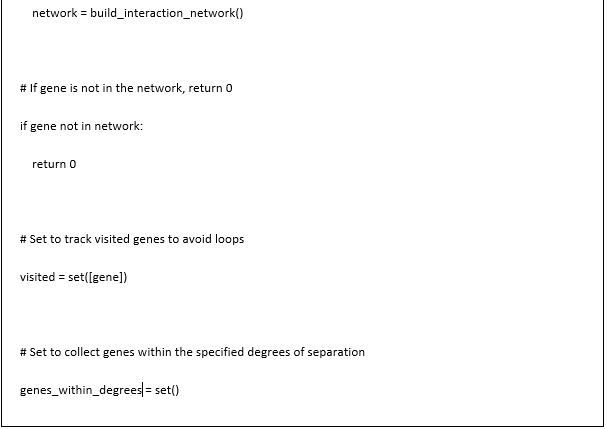
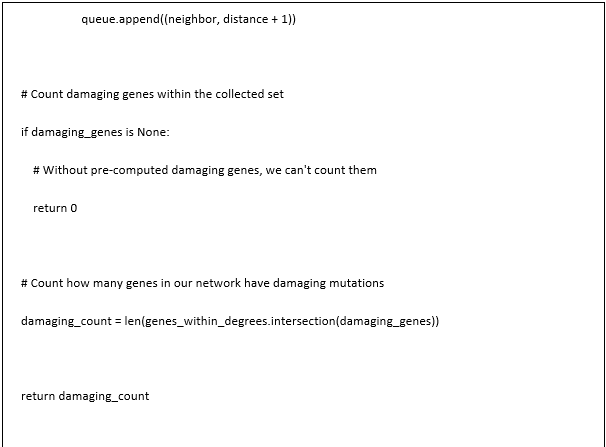
.png)
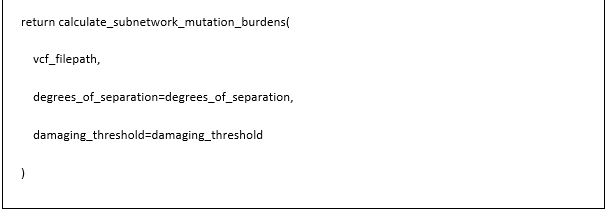
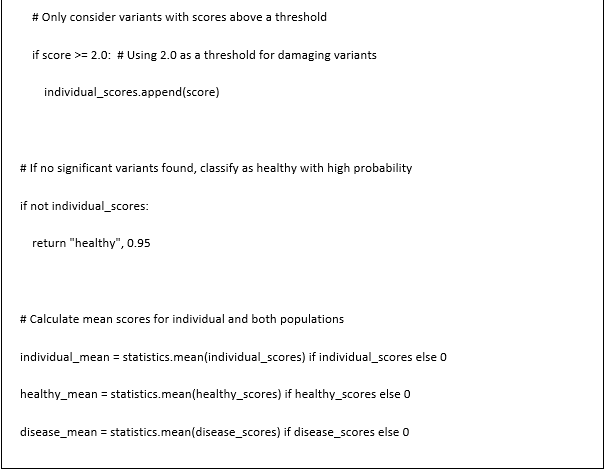
This code implements a gene interaction network analysis system through five interconnected functions focused on identifying potentially damaging genetic mutations within interaction networks. The framework begins with interaction_data(), which serves as a data provider returning a list of gene pair interactions where each interaction is represented as a two-element list containing gene names; this function essentially acts as a database of known gene-gene interactions. The build_interaction_network() function transforms these pairwise interactions into a comprehensive network structure represented as a Python dictionary where keys are gene names and values are sets of directly interacting genes, implementing bidirectional connections (if gene A interacts with gene B, then gene B also interacts with gene A) and handling empty interactions by skipping them. The core analytical capability is provided by count_damaging_interactions_by_gene(), which uses breadth-first search to explore a gene's interaction network up to a specified number of degrees away from the central gene, counting how many genes within this subnetwork contain damaging mutations; it tracks visited genes to avoid loops, maintains a collection of genes within the specified network distance, and ultimately intersects this collection with a pre-computed set of genes known to have damaging mutations. The calculate_subnetwork_mutation_burdens() function performs a comprehensive analysis by first parsing genetic variants from a VCF file, building the interaction network, identifying variants that exceed a specified damage threshold score (calculated using the previously defined disease_variant_score() function), and then for each gene with damaging variants, determining how many of its network neighbors (up to the specified degrees of separation) also have damaging mutations; the function returns a sorted list of results showing genes with the highest concentration of damaging mutations in their interaction neighborhoods, including both the count and a comma-separated list of the specific interacting genes with mutations. Finally, count_mutation_load() serves as a simple wrapper function that calls calculate_subnetwork_mutation_burdens() with the same parameters, providing a more concise entry point to the analysis. Together, these functions create a sophisticated pipeline for analyzing the distribution of potentially disease-causing mutations across gene interaction networks, allowing researchers to identify clusters or hotspots of mutations that might collectively contribute to disease through disruption of interconnected biological pathways.
The system includes several important steps starting with parse_vcf which pulls genetic variant information (chromosome, position, gene, frequency of the allele, pheno_status, functional_constrain, and prognostic scores, CADD, PolyPhen, SIFT, PrimateAI) from VCF files. Population-level analysis is performed by assess_population_variation(), which categorizes disease variant scores into condition A and condition B groups based on filename patterns, with the flexibility to analyze all variants or focus only on potentially damaging ones (scores ≥ 2.0). Individual risk assessment is handled by classify_individual(), which determines if a person is likely healthy or diseased by comparing their genetic profile against reference population distributions, calculating statistical distances between an individual's mean score and population means, and providing a probability of classification accuracy. The pipeline incorporates robust error handling, statistical processing via Python's statistics module, and manages edge cases such as empty variant sets and zero standard deviations, creating a computational framework that combines genomics with machine learning predictions to assess hereditary disease risk, evaluate mutation pathogenicity, and identify mutation hotspots in gene interaction networks.
Conclusion
This comprises of multiple analysis approaches to support the enhancement of genomic data analysis. The data extraction is generalized by the VCF parsing mechanism, and the pathogenicity assessment is based on familiar consensus approaches and genetically meaningful impact models. Population comparison framework is a statistical approach to rank the individuals at the population level using risk genes, allele frequency, constraint and prediction. In the same way, the occurrence of mutation effects is identified in correspondingly ordered and interconnected networks of genes, which can give the view of systematic genetic disorders. This system is organized in a large structure, applicable generally at the population level and also for predictive healthcare of single patients. Through statistical validation, the extent of risk or uncertainty in disease classification is effectively minimized, thereby making the variants well interpreted. The integration with gene network analysis provides added values in that it can predict the possibility of mutation that may or may not jointly contribute to disease progression. It would be useful in genomic, genetic, and precision medicine as it provides means for pathogenic variants’ identification and more importantly explanation of the biological relevance of the findings. This way, integrating genomic annotations, statistical methodologies, and interaction networks, the developed pipeline suggests a rational and efficient approach to genetic variant analysis, essential for further progress in personal medicine and prevention.
Fill the form to continue reading
Would you like to schedule a callback?
Send us a message and we will get back to you


Highlights
Earn While You Learn With Us
Confidentiality Agreement
Money Back Guarantee
Live Expert Sessions
550+ Ph.D Experts
21 Step Quality Check
100% Quality
24*7 Live Help
On Time Delivery
Plagiarism-Free

 81 Isla Avenue Glenroy, Mel, VIC, 3046 AU


