BUECO5903 Business Economics Assignment Part B Assignment Sample
Instructions:
1. This assessment contains five questions. You are required to answer all five questions.
2. This is an individual piece of assessment. Make sure your submission is an original submission.
This means it must be the creation of the person submitting it.
3. Follow Academic Integrity principles. Submissions that do not follow these principles will be penalised.
4. You are required to explain your reasoning and use diagrams where appropriate.
5. The assessment is worth 50 marks.
6. Due date: Please follow the due date as published in Moodle.
7. The assessment should be submitted electronically in the drop box in your Moodle shell.
Question 1
Table 1: International comparisons of economic growth and economic wellbeing
.png)
Yearly data from the World Bank.
Question 2
During the last two decades of the twentieth century, the difference in GDP per capita among the world’s richer countries (e.g. many countries in Western Europe, the UK, Japan, the US and Australia) and the once relatively poorer Asian countries (e.g. Singapore, Hong Kong, South Korea and Taiwan, known as the ‘Asian Tigers’) narrowed significantly. More recently, other countries have emerged as economic powerhouses, such as China, India, Russia and Brazil (known as the BRIC economies). In contrast, many African countries are still struggling to improve their economies and their living standards.
Question 3
Imagine a brother and sister who live in a capital city in one of Australia’s southern states – Adelaide, for example. They are young adults who have been registered as unemployed since they left high school a little over a year ago. They do not think there are any job prospects for them and have more or less given up looking for work. They spend most of their time sitting around at home watching television. However, they do make half-hearted attempts to look for work. For example, one afternoon each week they attend a local job club, and they are active on social media. Now imagine a man in his fifties who had worked in the local factory in a small regional town for most of his working life. He lost his job when the factory closed down and has been unable to find any work since. He does not go out to collect his unemployment benefit because he no longer expects to find work. He tries to find useful things to do around the house to fill in his time.
Question 4
Economic data is important to know the real status of an economy. It provides an empirical picture of an economy's condition. The following are economic data for Australia in 2019, 2020 and in 2021.
.png)
Question 5
Part A:
The Reserve Bank of Australia is responsible for monetary policy, the payments system and financial system stability, and for providing banking services to the banks, other financial institutions and the federal government. The RBA is also responsible for the production and issuance of Australian banknotes. Once every three years, the RBA conducts the Consumer Payments Survey (CPS). The 2019 CPS shows the increasing role of electronic payment methods rather than cash for day-to-day payments.
Question:
What are the major findings of the 2019 CPS?
Part B:
Visit https://www.rba.gov.au/media-releases/2021/mr-21-09.html to read the media release about a recent decision made by the Reserve Bank of Australia (RBA) that may affect the Australian economy.
Then answer the questions that follow.
Question:
Using your knowledge of economic theories, explain what this press release means when it states that low interest rates are acting to support borrowing and spending. Use graphs to illustrate and explain the effect of expansionary monetary policy on aggregate demand. (7 marks)
Solution
Answer 1:
1.
Table 1 shows economic growth as well as economic wellbeing of 15 countries including Australia from 2014 to 2019. From the table, it is observed that only economic growth of 14 countries and the world economy has fluctuated significantly over the years. Some countries like Australia, Norway, United States and the entire world have faced almost stable economic conditions as their economic growth have not fluctuated significantly. University Assignment Help, on the other side, economic growth of countries Brazil, China, India, and Singapore have fluctuated significantly during this period. The table also shows that economic growth of most of the countries have declined in 2019. As per the table and trend of economic growth from 2014 to 2019, it can be said that China, Nepal, Australia, United States and Vietnam have experienced higher economic wellbeing compared to other countries.
2.
The key measure of economic growth is gross domestic product (GDP), inflation and employment. GDP can be calculated by considering expenditure approach that includes private consumption (C), private investment (I), government expenditure (G) and net export (NI). Hence, GDP = C + I + G + NI
To calculate inflation, consumer price index (CPI) is considered. Here, the CPI of past date is subtracted from the CPI of the present date and is divided the outcome by the CPI of the past date. For getting the outcome in percentage, the outcome is multiplied by 100.
Hence, Inflation rate = [(CPI of current date – CPI of past date)/ CPI of past date] *100
To measure employment rate, the number of employed people is divided by the total population.
3.
Other than GDP, inflation rate and employment rate are used to measure compare economic wellbeing. By measuring inflation, one can understand the price of a basket of goods and this in turn helps to understand expenditure of households. It is known that high and unstable inflation rate can adversely affect economic well-being of a nation by declining purchasing power of people who have fixed income. On the other side, low rate of inflation is considered good for the economy and hence it helps to increase country’s well-being.
Moreover, employment rate also reflects economic well-being of a country. By measuring this rate, one can understand how fast the number of working people increases in the total labour force. Higher employment rate shows that the economy is performing well as this indicator has a positive relationship with economic growth. Higher employment implies higher per capita income and higher consumption, investment and productivity.
Answer 2:
Long-run economic growth occurs when an increasing long-run aggregate productivity tends the productive capacity of an economy to increase. Some determinants of long-run growth are growth of productivity and demographic change (Han and Lee 2020). Here, growth of productivity is measured in terms of GDP growth rate and demographic change is measured by population growth rate. By analysing these two factors, it can be said that which country are capable to achieve growth in the long-term and a new economic dominance.
GDP Growth Rate (Annual %)
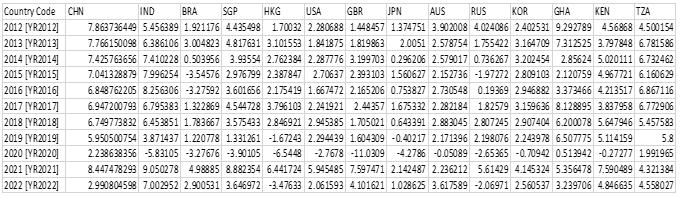
Table 1: Annual Growth of GDP (in annual %)
.png)
Figure 1: GDP Growth Rate (in annual %)
Source: (World Development Indicators. 2023)
Figure 1 represents GDP growth rate of 14 countries some of which are world’s richer countries while some are poorer Asian countries. Moreover, the table also shows BRIC economies to demonstrate how their GDP growth rate improve over the years between 2012 and 2022. From figure, it is observed that economic growth of each country fluctuates over the years but the rate of fluctuation is not same for all of them. Each country faced a massive decline in 2020 due to the outbreak of COVID-19. However, countries like India, Germany, Australia, Kenya and Tanzania performed well and achieved a significant economic growth in the year of 2021.
Population Growth Rate (%)
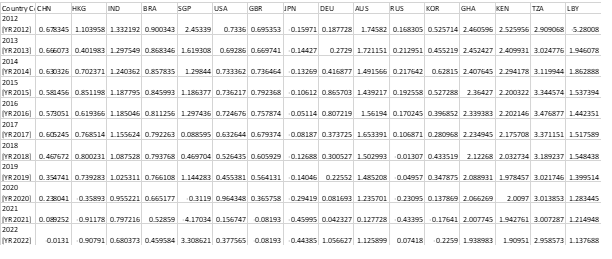
.png)
Figure 2: Population Growth Rate
Source: (World Development Indicators. 2023)
It is seen from figure 2 that population growth has declined in China, Hong Kong, Germany and Japan on 2022 compared to that in the previous year. On the other side, population rate has increased in Singapore, Australia, Germany and Russia. According to macroeconomic concept, population growth has a positive relationship with long-term economic growth. In other words, more population tends a country to get a larger workforce which provide labour in production process. As labour is an important factor of production process, more labour causes more production and this in turn brings economic growth.
After analysis, it can be said that countries like Australia and Germany can achieve long-term economic growth as both countries have experienced positive productivity growth and population growth after experiencing pandemic.
2.
The basic difference between production and productivity is that the former represents the number of goods and services produced in a specific time period and the later implies the level of use of resources such as labour or capital. A country can achieve economic growth if its production. According to the concept of GDP, a country can achieve economic growth if a production factor increases. For instance, in labour increases, then more labour can produce comparatively more unit of outputs than before and hence total production of the economy will increase. On the other side, productivity of a country increases when more output can be produced with the same amount of inputs. Hence, increase in productivity also allows a country to achieve higher national income by getting more amount of output and this in turn can bring a long-term economic growth.
3.
The long-term growth strategy related to endogenous growth model states that economic force can be achieved through internal forces, which are human capital, knowledge ad innovation. These factors provide the opportunity and incentive of making technological knowledge (Gross and Klein 2022). The model does not consider that external forces such as physical investment bring economic growth. As per the model, productivity can be improved through faster innovation and making investment in human capital.
On the other side, the Solow growth model represents as an exogenous model related to economic growth. As per the mode, Output level of an economy changes over time due to the change in the population growth rate, technological progress and the savings rate (Nikolaos and Tsaliki 2021) and investment by enhancing the capital stock and the situation in tern helps to increase national income and product.
Thus, Solow growth model focuses on technology while endogenous growth model considers economic factors in describing economic growth.
Answer 3:
1.
The young siblings can be classified as structural unemployed. This form of unemployment occurs due to the mismatch between the need of the companies and skills possessed by available workers (Hashimoto, Ono and Schlegl 2023). In the given scenario, siblings consider that they do not have any job prospects for them and hence they give up for searching a new job. However, they tried to find jobs attending a local job club and remaining active on social media to get a new job opportunity. If firms hire high-school pass out candidates who do not have proper skills to perform tasks then the structural unemployment rate can be considered as overstated.
2.
As per the given scenario, the man can be considered as voluntarily unemployed. This is because, the person did not want to do any job after closing down of his local factory. He did not receive any unemployment benefit for finding a new job later. Hence, the person did not try to get a new job voluntarily (Churchill and Khan 2021). This form of unemployment leads the government to understand true unemployment as employees remain discouraged.
3.
Structural unemployment can be considered as a more serious type of unemployment over the voluntary unemployment. This is because, structural unemployment occurs due to the economic cycle and hence economists and policymakers consider it seriously.
On the other side, voluntary unemployment is based completely on the decision of a person and it is does not related to the entire labour force. The situation can be occurred even if the economy has enough job opportunity when a person can voluntarily decide whether she or he wants to work at the present wages or not.
Answer 4:
1.
.png)
Figure 3: Short-run AD- AS curves
As per the given table, inflation rate of Australia increased in March 2020 compared to that in the March of previous year. Increasing inflation tends real GDP to decline due to the decreasing value of money. As a result, the aggregate demand curve declines and shift to the left. Here, SD0 represents aggregate demand curve of March 2019 and AD1 represents aggregate demand curve of March 2020. As a result, output of the country declines from Y* to Y1. Moreover, the price level also declines from P* to P1.
Furthermore, inflation rate of Australia declines in March 2021 compared to that in the previous year. Consequently, the aggregate demand curve will increase to the rightward and this in turn will increase real GDP and price level. This situation is depicted in figure 1. In figure, AD2 represents aggregate demand curve of the country of March 2021. As demand increases, real GDP increases from Y1 to Y2 while price level increases to P2 from P1. However, the March 2021 inflation rate is lower than that of March 2019. Hence AD2 curve is increased but it remains below the AD0 curve.
2.
As it is seen from the given table that unemployment rate of Australia increased in March 2020 and again it declined in March 2021. On the other side, inflation rate of the country also increased in March 2020 but declined in the next year. Furthermore, economic growth rate of Australia declined continuously in 3 consecutive years. The overall scenario implies that unemployment rate of Australia remained above 5% over the 3 years. Moreover, inflation rate was low during this period and economic growth also declined over these years. Hence, the changes of these indicators are not good for the economy.
3.
By implementing expansionary fiscal policy, the government can increase aggregate demand of the economy. This will help the economic growth of Australia to increase over time. Moreover, as it is seen that the economy has low inflation, which is around 1%, it can be said that the economy is growing slowly. This situation shows that there is enough capacity to increase productivity, generating more employment opportunity and achieving positive economic growth.
Answer 5:
Part A:
The 2019 Consumer Payments Survey (CPS) states that the use of cash for the purpose of transaction has declined continuously while the use of electronic payment methods has increased during this time (Ausbanking. 2022). The Australian consumers increased their electronic payment methods for their transaction purpose. As per the survey, the use of debit card increased significantly especially for ‘tap and go’ option. Furthermore, contactless payment facility using mobile devices has increased significantly while, on the other side, mobile devices for making payments at the sale point remained relatively low.
Part B:
According to the press release, Australia has strongly recovered its economy after pandemic and it was beyond expectation. While increasing GDP growth and decreasing unemployment rate indicate a good prospect for the country to grow, low inflation rate and wage pressures generate challenges for the economy. The Reserve Bank of Australia expected inflation in underlying terms to be 1 ½ per cent in 2021 and 2% in the next year (RBA. 2021). Moreover, CPI inflation is also expected to increase by more than 3% temporarily in June quarter 2021 due to the reduction in Covid related prices. Due to price increase in each major market, housing markets have become stronger and consequently, the growth of housing credit has increased due to strong demand from first-home buyers. Furthermore, an increasing tendency of borrowing has also been observed among investors. Thus, the increasing house prices along with low interest rates lead the Bank to observe the trend of housing borrowing closely for maintaining lending standards.
Thus, it is essential to analyse and understand the implication of low interest rate in supporting borrowing and spending of houses. As per macroeconomic theory, it is known that low interest rates allow consumers to spend more as their disposable income increases. Hence, consumers tend to make larger payments and intend to borrow more amount of money from banks. This in turn increases the demand for houses, especially to first-home purchasers. On the contrary, high rate of interest makes borrowing costly and hence people tend to save more instead of borrowing money (Caballero and Simsek 2023). The Reserve Bank of Australia uses interest rate as a tool of monetary policy. During expansionary monetary policy, the RBA declines interest rate to increase credit supply within the economy. The impact of expansionary monetary policy is shown in the figure below:
.png)
Figure 4: Impact of Expansionary Monetary Policy of Aggregate Demand
The impact of expansionary monetary policy on aggregate demand is shown in figure 4. Here, the demand curve shifts from AD0 to AD1 due to increasing consumer spending as interest rate goes down. Consequently, real GDP increases from Y0 to Y1 and price level also increases to P1 from P0.
References:
RBA. 2021. Statement by Philip Lowe, Governor: Monetary Policy Decision: Media Releases, Reserve Bank of Australia. scheme=AGLSTERMS.AglsAgent; corporateName=Reserve Bank of Australia. Available at: https://www.rba.gov.au/media-releases/2021/mr-21-09.html (Accessed: 5 October 2023).
Caballero, R.J. and Simsek, A., 2023. A note on temporary supply shocks with aggregate demand inertia. American Economic Review: Insights, 5(2), pp.241-258.
Hashimoto, K.I., Ono, Y. and Schlegl, M., 2023. Structural unemployment, underemployment, and secular stagnation. Journal of Economic Theory, 209, p.105641.
Churchill, B. and Khan, C., 2021. Youth underemployment: A review of research on young people and the problems of less (er) employment in an era of mass education. Sociology Compass, 15(10), p.e12921.
Gross, T. and Klein, P., 2022. Optimal tax policy and endogenous growth through innovation. Journal of Public Economics, 209, p.104645.
Nikolaos, C. and Tsaliki, P., 2021. The dynamics of capital accumulation in Marx and Solow. Structural Change and Economic Dynamics, 57, pp.148-158.
Han, J.S. and Lee, J.W., 2020. Demographic change, human capital, and economic growth in Korea. Japan and the World Economy, 53, p.100984.
World Development Indicators. 2023. DataBank. Available at: https://databank.worldbank.org/source/world-development-indicators (Accessed: 5 October 2023).
Ausbanking. 2022. Consumer Payment Behaviour in Australia Evidence from the Consumer Payments Survey – 2019. Australian Banking Association. Available at: https://www.ausbanking.org.au/report/consumer-payment-behaviour-in-australia-evidence-from-the-consumer-payments-survey/ (Accessed: 5 October 2023).
Fill the form to continue reading
Would you like to schedule a callback?
Send us a message and we will get back to you


Highlights
Earn While You Learn With Us
Confidentiality Agreement
Money Back Guarantee
Live Expert Sessions
550+ Ph.D Experts
21 Step Quality Check
100% Quality
24*7 Live Help
On Time Delivery
Plagiarism-Free

 81 Isla Avenue Glenroy, Mel, VIC, 3046 AU


