BUS5DWR Data Wrangling and R Report 3 Sample
Overview
This assignment allows you to demonstrate your knowledge and skills of data wrangling with Text editors and R. Please carefully read the entire assignment to make sure you understand the requirements, the submission format and marking rubrics before starting.
Specific Requirements
The data received from Vivino wine rating IT department comprises three data files: Wine.xlsx, WineRating.txt and Region.csv. The Wine.xlsx file records the information of wine list across the world which detailed information about their ratings is recorded in WineRating.txt and Region.csv records the country of each wine region.
You are asked to:
1 Import all the data from different files into three dataframes. Write R codes to fill the last three empty columns in the Wine dataframe with appropriate information provided from the other datasets. (Hint: using merge function....)
2 Assess the data and correct it if necessary.
a) Assess data in Wine data frame. (We can describe the expected output here. For example: in each column,students write R code to show: datatype, min-max value (if it is numeric). Write some sentences to describe issues in column (if necessary))
b) Correct data: write R code to fix issues in columns (if necessary)
3 Investigate the data distribution of wine price by drawing its histogram and boxplot and providing your insight.
4 The company wants to collaborate with favourite wineries to expand its market. To support managers’ decision making, you are required to:
a) Propose a ranking with at least 2 criteria to rank the wineries for the company to
choose for their next collaboration. Provide your justification.
b) Create a dataframe which contains the best wineries based on your ranking. Display the list of the wineries in the descending order of your proposed criteria, i.e., the best one first. You can consider different markets or wine types if necessary. Make the dataframe concise and comprehensive (having meaningful number of columns, column titles, appropriate data format, etc.)
5 Based on your answer to Questions 1 to 4, you come up with discussions on the outcomes and recommendations for managers on how to expand their market. Note that if this part is missing or the content of this part does not match the R file, no mark will be awarded for the whole assignment.
Solution
Data Preparation
Data preparation is a crucial initial step in any data analysis process. It thus involves several key stages, including importing the dataset, assessing its properties, specifically correcting any issues that may practically be present, and preparing the data for further analysis. Uni Assignment Help, This process predominantly ensures that the data primarily used for analysis is, therefore, reliable, accurate, and suitable for the intended purpose.
To begin with, the process of importing data primarily involves using specific functions, particularly within R, to practically load the dataset into the environment. Commonly used functions specifically practically for this purpose include `read.csv()`, `read.table()`, and even similar ones. These functions primarily allow for seamless retrieval of data from various file formats, particularly such as CSV, Excel, or text files, and also make them accessible particularly for analysis within the R environment.
After successfully importing the data, the next step is, therefore, to assess its characteristics and properties. This involves using a variety of functions to gain an initial understanding of the dataset's structure. For instance, `head()` practically provides a glimpse of the first few rows, specifically offering a preview of the data's content. Meanwhile, `summary()` delivers summary statistics primarily like mean, median, and quartiles, along with information on missing values. `str()` specifically provides a concise overview of the data's structure, specifically including the type of each variable. Finally, `dim()` offers the particular dimensions of the dataset, thereby indicating the number of rows and columns.
Following the assessment stage, it is specifically imperative to address any issues identified during the evaluation. This involves the correction of missing values, outliers, or even inconsistencies within the data. Missing values, if left unattended, can lead to biased analyses and erroneous conclusions. Strategies to practically handle missing data include imputation methods like mean imputation, median imputation, or sophisticated techniques like multiple imputation.
Outliers, on the other hand, can, therefore, significantly skew statistical analyses and machine learning models. They should thus be carefully examined to determine if they specifically represent genuine data points or erroneous entries. Depending on the context, outliers can thus be either corrected or treated separately, particularly in the analysis.
Inconsistencies in the data, such as conflicting entries or even erroneous values, should be rectified to ensure the accuracy and integrity of subsequent analyses. This may specifically involve cross-referencing primarily with external sources or consulting domain experts to validate or even correct the information.
Once the data has, therefore, been assessed and corrected, it is then practically prepared for further analysis (Balduzzi et al., 2019). This step specifically encompasses a range of activities, including data cleaning, transformation, and feature engineering. Data cleaning particularly involves tasks like standardising formats, specifically removing duplicates, and also ensuring consistency in naming conventions. Transformation may thus involve scaling variables, creating new variables, or aggregating data for specific analyses. Feature engineering, a more advanced step, specifically focuses on creating new variables or even features that better represent the underlying patterns in the data.
Data preparation is specifically an indispensable process in any data analysis endeavour. It therefore involves importing the data, thereby assessing its properties, correcting any issues, and preparing it for subsequent analyses. By diligently following these steps, analysts primarily ensure that the data used predominantly for further exploration and even modelling is accurate, reliable, and well-suited for the intended purpose. This meticulous approach specifically sets the foundation for robust and trustworthy data-driven insights and conclusions.
Data Analysis (Histogram/Boxplot)

Data Analysis (Ranking/Summarising)
Discussion
The data analysis specifically revealed valuable insights into the performance and standing of the wineries, thereby aiding in informed decision-making specifically for potential collaborations.
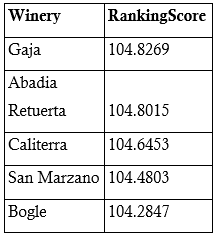
The analysis practically highlighted discernible trends and patterns among the wineries. Notably, Gaja primarily emerged as the top-ranked winery, particularly with a score of 104.8269, thereby followed closely by Abadia Retuerta with a score of 104.8015. Caliterra, San Marzano, and Bogle also demonstrated specifically commendable rankings, scoring 104.6453, 104.4803, and 104.2847, respectively. This predominantly suggests a relatively narrow margin in the rankings, thereby signifying a competitive landscape in the wine industry.
The proposed ranking was therefore determined based on a combination of factors, primarily the 'RankingScore' metric. This metric primarily incorporates various attributes such as product quality, customer ratings, and other undisclosed proprietary factors. The winery with the highest 'RankingScore' was thus accorded the top position, therefore indicating superior performance specifically across these parameters.
The criteria used to rank the wineries were deliberately chosen to provide a comprehensive evaluation. This predominantly included considering customer ratings, which, therefore, serve as a reliable indicator of consumer satisfaction and product quality. The number of ratings was taken into account to gauge the wineries' popularity and even market presence. These criteria thus collectively provided a balanced assessment, thus allowing for an equitable comparison.
The implications of this ranking are specifically substantial for the company's potential collaborations. Gaja and Abadia Retuerta, thereby occupying the top two positions, stand out as strong contenders predominantly for collaboration opportunities. Their high rankings and even favourable customer ratings primarily suggest a well-established reputation and a dedicated consumer base (Gostic et al., 2020). Collaborating with these wineries could lead to mutually beneficial partnerships, therefore expanding market reach and enhancing the company's product portfolio.
The competitive landscape, primarily among the wineries, specifically underscores the importance of strategic collaborations. While Gaja and Abadia Retuerta may, therefore, hold the top positions, the relatively narrow gap in rankings predominantly indicates a dynamic industry where opportunities primarily for collaboration and growth abound. The company should leverage this competitive environment to practically explore partnerships with wineries that align specifically with its strategic objectives and target market.
The data analysis specifically provided valuable insights into the performance of the wineries, thereby facilitating informed decision-making for potential collaborations. The proposed ranking, practically based on a combination of factors, therefore offers a comprehensive evaluation of the wineries' standing. This ranking will thereby be instrumental in guiding the company's collaboration efforts, primarily ensuring strategic and mutually beneficial partnerships in the competitive wine industry.
References
Balduzzi, S., Rücker, G. and Schwarzer, G., 2019. How to perform a meta-analysis with R: a practical tutorial. BMJ Ment Health, 22(4), pp.153-160.
Gostic, K.M., McGough, L., Baskerville, E.B., Abbott, S., Joshi, K., Tedijanto, C., Kahn, R., Niehus, R., Hay, J.A., De Salazar, P.M. and Hellewell, J., 2020.
Practical considerations for measuring the effective reproductive number, R t. PLoS computational biology, 16(12), p.e1008409.
Fill the form to continue reading
Would you like to schedule a callback?
Send us a message and we will get back to you
Main Services
- Accounting Assignment Help
- Accounting Assignment Helper
- Accounting Case Study Assignment Help
- Accounting Essay Help
- Assignment Help Adelaide
- Assignment Help Auckland
- Assignment Help Ballarat
- Assignment Help Bendigo
- Assignment Help Birmingham
- Assignment Help Brisbane
- Assignment Help Bristol
- Assignment Help Calgary
- Assignment Help Canberra
- Assignment Help Darwin
- Assignment Help Dubai
- Assignment Help Dublin
- Assignment Help Geelong
- Assignment Help Gold Coast
- Assignment Help Griffith
- Assignment Help Hamilton
- Assignment Help Hobart
- Assignment Help Liverpool
- Assignment Help London
- Assignment Help Manchester
- Assignment Help New York
- Assignment Help Newcastle
- Assignment Help Oxford
- Assignment Help Perth
- Assignment Help Sydney
- Assignment Help Toowoomba
- Assignment Help Toronto
- Assignment Help Wellington
- Assignment Writing Help
- AU
- Auditing Assignment Help
- Biology Assignment Help
- Bond University Assignment Help
- Business Accounting Assignment Help
- Buy Research Paper
- CA
- Case Study Help
- Corporate Accounting Assignment Help
- Cost Accounting Assignment Help
- Coursework Writing Help
- Curtin University Assignment Help
- Deakin University Assignment Help
- Dissertation Writing Help
- Do My Accounting Assignment
- Do My Accounting Papers
- Do My Finance Assignment
- Economics Assignment Help
- Engineering Assignment Help
- Essay Writing Help
- Federation University Assignment Help
- Finance Assignment Help
- Financial Planning Assignment Help
- Flinders University Assignment Help
- Holmes Institute Assignment Help
- Humanities Assignment Help
- IT Assignment Help
- JCU Assignment Help
- Kaplan Business School Assignment Help
- La Trobe University Assignment Help
- Law Assignment Help
- Leader Institute Assignment Help
- Management Assignment Help
- Managerial Accounting Assignment Help
- Mathematics Assignment Help
- Monash University Assignment Help
- MY
- Nursing Assignment Help
- NZ
- PIA University Assignment Help
- Programming Assignment Help
- Queensland University of Technology Assignment Hel
- Research Paper Help
- Research Paper Writers
- Research Paper Writing Help
- Research Paper Writing Service
- RMIT University Assignment Help
- Science Assignment Help
- SG
- Swinburne University of Technology Assignment Help
- Thesis Writing Help
- UAE
- UK
- UNSW Assignment Help
- US
- Victoria University Assessment Help
- VIT University Assignment Help
- Write My Assignment
- Write My Research Paper


Highlights
Earn While You Learn With Us
Confidentiality Agreement
Money Back Guarantee
Live Expert Sessions
550+ Ph.D Experts
21 Step Quality Check
100% Quality
24*7 Live Help
On Time Delivery
Plagiarism-Free
Our Samples
- DATA4400 Data-driven Decision Making and Forecasting Report 3 Sample
- Strategic and Operating Health Management Report 2 Sample
- HI6034 Enterprise Information Systems Report Sample
- PPMP20007 Project Management Concept Report Sample
- HCCSSD104 Lifespan Development Report 3 Sample
- OPS911 Strategic Procurement Management Report Sample
- ITW601 Information Technology – Work Integrated Learning Report 2 Sample
- EDES300 Comparative Education Report 3 Sample
- PBHL20001 Understanding Public Health Essay 3 Sample
- MEM603 Engineering Strategy Report 2 Sample
- MBA504 Introduction to Data Analytics for Business Case Study 1 Sample
- MIS603 Microservices Architecture Report 3 Sample
- TECH4100 UX and Design Thinking Report 2 Sample
- MBA504 Introduction to Data Analytics for Business Case Study 2 Sample
- DATA4200 Data Acquisition and Management Report 1 Sample
- PRJ5106 Research Methodology and Data Analysis Assignment 2 Sample
- UNCC300 Justice and Change in a Global World Report 2 Sample
- BUS2008 Strategic Planning Report Sample
- MG301 Agriculture and Resource Policy Case Study Sample
- CWB103 Interpersonal and Intercultural Negotiation Assessment 1 Sample
- INFS5023 Information Systems for Business Case Study Sample
- Marketing Assignment Writing Sample
- HI5030 Systems Analysis and Design Case Study Sample
- EDU30059 Teaching Technologies Report 2 Sample
- MIS608 Agile Project Management Report 1 Sample
- NURBN1016 Primary Health Essay 2 Sample
- ACCT6007 Financial Accounting Theory and Practice Report 2 Sample
- MBA643 Project Risk, Finance, and Monitoring Report 3 Sample
- DATA6000 Capstone: Industry Case Studies Report Sample
- DHI401 Digital Health and Informatics Report 2 Sample
- TECH2300 Service and Operations Management in IT Report 3 Sample
- HCCSSD202 Diversity and Inclusion Case Study 3 Sample
- MC7080 Digital Marketing & Social Media Report Sample
- ENEG11005 Introduction to Contemporary Engineering Report Sample
- CAO107 Computer Architecture & Operating Systems Report 2 Sample
- COU202 Counselling Theory and Practice Task 4 Report Sample
- PROJ6000 Principles of Project Management Report Sample
- PROJ-6012 Managing Information Systems, Technology Report Sample
- IM401 Introduction to Agroinformatics Report Sample
- BUS5103 Marketing and Communication Essay 2 Sample
- GDECE101 Early Childhood Care and Education Report Sample
- FE7066 Data Analysis for Global Business Coursework Sample
- ECON20039 Economics for Managers Report 2 Sample
- INT103 Human Development Across the Lifespan Report 2 Sample
- Organisational Behaviour (OB) Essay Sample
- MITS4001 Business Information Systems Case Study 3 Sample
- TECH2300 Service and Operations Management in IT Case Study 2 Sample
- COIT20248 Information Systems Analysis & Design Report 1 Sample
- NURBN3033 Primary Health Report Sample
- PUBH6008 Capstone A Applied Research Project in Public Health Report 2 Sample
- MBA404 Consumer Behaviour and Marketing Psychology Report Sample
- HI5004 Marketing Management Case Study Sample
- MGT502 Business Communication Report 1B Sample
- TO5103 Global Destination Competitiveness Report Sample
- ICT5151 Data and Information Management Report 4 Sample
- GAL613 Grief and Loss Essay Sample
- OB223 Organisational Behaviour Report Sample
- PUBH1425 Life History and Determinants of Health Report Sample
- DATA4000 Introduction to Business Analytics Report 3
- MBA6204 Managing the Quantitative Support of Decision Making Report 2 Sample
- NURS2021 Dimensions of Physical and Mental Health Case Study 3 Sample
- MIS100 Information Systems Case Study 2 Sample
- LAW6001 Taxation Law Case Study Sample
- OPS928 Logistics Systems Assignment Sample
- HI5031 Professional Issues in IS Ethics and Practice Case Study Sample
- WELF1014 Human Service Provision Essay Sample
- MIS611 Information Systems Capstone Report 1 Sample
- DATA4700 Digital Marketing and Competitive Advantage Report 3 Sample
- HS7000 Information Systems in Business Research Report Sample
- GDECE102 Learning and Development Birth To Two Years Report 1 Sample
- CMT218 Data Visualisation Case Study Sample
- ETCH304 Diverse Literacy and Numeracy Learners Report 1 Sample
- MITS5004 IT Security Research Report 2 Sample
- TECH1400 Database Design and Management Case Study Sample
- MBA642 Project Initiation, Planning and Execution Report Sample
- MBA600 Capstone Strategy Essay 3 Sample
- PSYC20036 Applied Positive Psychology Essay Sample
- SBM3204 Sustainability and Ethics Case Study Sample
- PPMP20009 Case Study Sample
- EDU20014 Social and Emotional Learning Report Sample
- HA3011 Accounting Report Sample
- Investigating The Issue of Inequality in Workplaces Essay Sample
- ICT606 Machine Learning Report Sample
- BULAW5915 Corporate Law Assignment Sample
- BLCN29001 Construction Technology Report Sample
- BE489 Analysing Organizations in the International Report Sample
- OPS909 Total Quality Management Report Sample
- BUS2003 Data Engineering & Python Report 1 Sample
- Information Security PG Assignment Sample
- SAP101 Foundations of Sociology and Politics for Community Services Workers Essay 2 Sample
- INT101 Introduction to International Relations and Politics Essay Sample
- MIS605 Systems Analysis and Design Report Sample
- PRJ5001 Project Management Profession Report Sample
- TECH2100 Introduction to Information Networks Report 1 Sample
- MBA641 Strategic Project Management Report Sample
- ACC202 Contemporary Financial Accounting Report Sample
- M33117 Public Policies and Labour Markets Report Sample
- COIT20249 Professional Skills in Information Communication Technology Report 2 Sample
- TECH8000 IT Capstone Report 1 Sample
- Economics for Business Assignment Sample
- MBA503 Operations Management and Decision-Making Models Report 3 Sample
- MBA404 Consumer Behaviour and Marketing Psychology Report 3 Sample
- MBA501 Dynamic Strategy and Disruptive Innovation Case Study 1 Sample
- CPO442 Cybersecurity Principles and Organisational Practice Report 2 Sample
- AT3 Nursing Case Study Sample
- BUMKT5902 Marketing Mix Strategy Report Sample
- HI5033 Database System Report Sample
- DATA4500 Social Media Analytics Case Study Sample
- BSBPMG535 Manage Project Information and Communication Business Documents Diploma Sample
- OPS909 Total Quality Management Report 1 Sample
- MITS6004 Enterprise Systems Report 1 Sample
- MIS605 Systems Analysis and Design Report 2 Sample
- CAP203 Care of The Person With An Acute Illness Report 4 Sample
- FIN311 Agricultural Accounting and Business Law Part A Report Sample
- OPS802 Operations Management Report 3 Sample
- OPS802 Operations Management of Subway Research Report 4 Sample
- CA7013 Sustatnability in Global Companies 2022-23 Report
- BUS6302 Integrated Marketing Communications Report 1 Sample
- ECE6003 Contemporary Issues, Social Contexts of Learning and Social Justice Sample
- MBA6104 Business Process Modelling & Management Report Sample
- EDU10005 Indigenous Education and Perspectives Essay 2 Sample
- ECOM4000 Economics Report 3 Sample
- MBIS5009 Business Analytics Report Sample
- DSMG29001 Disaster Risk Reduction Report 2 Sample
- COU101 Theories of Counselling Essay Sample
- MBA7069 Leadership and Management Report Sample
- LB5231 Corporate Responsibility and Governance Report 2 Sample
- DATA4000 Introduction to Business Analytics Case Study 1 Sample
- HCCSSD103 Mental Health Case Study 3 Sample
- Child Development Case Study Sample
- Local Government Area LGA Essay 2 Sample
- ICT101 Discrete Mathematics Report 3 Sample
- MBA6302 Integrated Marketing Communications Report Sample
- LB5230 Managing Strategic Resources and Operations Report 2 Sample
- M5011 Accounting for Management Report Sample
- Personal Improvement Plan Report Sample
- PUBH6008 Capstone A Applied Research Project in Public Health Report Sample
- TECH3200 Artificial Intelligence and Machine Learning in IT Report 3 Sample
- ECON7200 Economic Principles Report Sample
- MECO6912 Political Public Relations Report 1 Sample
- MBA5008 Business Research Methods Report 2 Sample
- MITS5502 Developing Enterprise Systems Report Sample
- EC102 Agricultural Economics Assignment Sample
- DATA4900 Innovation and Creativity in Business Analytics Report 4 Sample
- 7318AFE Business Data Analytics Report 2 Sample
- MIS775 Decision Modelling for Business Analytics Report Sample
- MIS610 Advanced Professional Practice Report 2 Sample
- BUS600 Organisational Behaviour and Leadership Report 2 Sample
- TECH8000 IT Capstone Report Sample
- MIS500 Foundations of Information Systems Report Sample
- TCHR2003 Curriculum Studies in Early Childhood Education Report 2 Sample
- TECH2200 IT Project Management Case Study Sample
- MGT502 Business Communication Report 2 Sample
- EC400 Agribusiness Economics and Finance Case Study 3 Sample
- MOB6110 Creating Entrepreneurial Leaders Report Sample
- TCHR3004 Leadership and Advocacy in Early Childhood Report 1 Sample
- MBA5004 Managing Decision Making Process Report 2 Sample
- EC501 International Economic Development Report 1 Sample
- MCR001 Economics Case Study Sample
- BIS3006 IS Capstone Industry Project B Report Sample
- 6006MHR Project Management Report Sample
- HCCSSD102 Person Centred Practice Report 1 Sample
- BUS107 Business Ethics Report 3 Sample
- TUM202 Therapeutic use of Medicines Report 2 Sample
- MBA504 Introduction to Data Analytics for Business Report 3 Sample
- ENGIN5210 Engineering Project Execution Research Report 1 Sample
- PPMP20009 Control Charts and Process Mapping Assignment Sample
- MBA402 Governance, Ethics and Sustainability Report 3 Sample
- ACCY801 Accounting and Financial Management Report 2 Sample
- ECUR302 Mathematics in the Early Years Report Sample
- FIT5057 Project Management Case Study 1 Sample
- MIS610 Advanced Professional Practice Report 2 Sample
- CSE2AIF/CSE4002 Artificial Intelligence Fundamentals Report Sample
- ENGR8931 Geotechnical Engineering GE 1st Copy Sample
- Critically Examine and Identify the Issues within The Case Study from a Legal and Ethical Perspectiv
- NURBN2026 Person Centered Nursing Sample
- HDW204 Healthcare in the Digital World Report 2 Sample
- DATA4600 Business Analytics Project Management Case Study 1 Sample
- MBA402 Governance, Ethics and Sustainability Report 3 Sample
- HI5004 Marketing Management Assignment Sample
- ENEG28001 Australian Engineering Practice Report 1 Sample
- Impact of Green Supply Chain Management on The Profitability of The Retail Industry Sample
- MBIS5013 Sustainability and Enterprise 4.0 Report 2 Sample
- PSYC20042 Psychology, Wellbeing, and Resilience Website Blog Report 2 Sample
- MBIS5010 Professional Practice in Information Systems Case Study 3 Sample
- ICC104 Introduction to Cloud Computing Report 2 Sample
- COIT20252 Business Process Management Report 3 Sample
- EDU20014 Social and Emotional Learning Report Sample
- OPS910 Linear Programming Assignment Sample
- HI5017 Managerial Accounting Report Sample
- MGT501 Business Environment Report Sample
- HSV3245 Contemporary Mental Health Practice Report 3 Sample
- MITS6002 Business Analytics Research Report Sample
- MGT610 Organisational Best Practice Case Study 2 Sample
- BIZZ201 Accounting for Decision Making Report Sample
- Planning in Health and Social Care Essay Sample
- PRJ5105 Project Integration and Change Management Report 3 Sample
- MBA401 People, Culture and Contemporary Leadership Report Sample
- NRSG7377 Transition To Contemporary Nursing and Clinical Leadership Report 2 Sample
- BUMGT6973 Project Management Case Study Sample
- MBAS906 Business Analytics Research Capstone Research Report 1 Sample
- CISM4000 Information Systems in Accounting Report 3 Sample
- AC400 Agribusiness Accounting Report 2 Sample
- TECH1300 Information Systems in Business Case Study 2 Sample
- BUECO5903 Business Economics Assignment Part B Assignment Sample
- MKTG6002 Marketing Report 3 Sample
- Enem28001 fea for engineering design report sample
- MBIS5013 Sustainability and Enterprise 4.0 Report 3 Sample
- BM303 Contemporary Issues in Agribusiness Production and Management Case Study Sample
- NURBN3031 Teaching, Learning and Situational Leadership for Health Practice Sample
- TECH2100 Introduction to Information Networks Report 3 Sample
- SAP103 Introduction to Welfare Law Report 2 Sample
- MOB6110 Creating Entrepreneurial Leaders Report Sample
- DATA4000 Introduction to Business Analytics Report 3 Sample
- MBA602 Small Business Administration Case Study 2 Sample
- MGT607 Innovation, Creativity & Entrepreneurship Case Study Assignment Sample
- OPS928 Logistics Systems Report 2 Sample
- MAC002A Accounting Information Systems Report Sample
- HI6036 IS Strategy and Innovation Case Study Sample
- HNO6008 Mental Health Nursing Report 3 Sample
- DSMG2002 Exploring Emergency in Disaster Management Research Report 1 Sample
- MITS4004 IT Networking and Communication Report Sample
- Principles of Economics Assignment Sample
- MK101 Marketing Foundations Report Sample
- ECX2953/ECX5953 Economics Essay Sample
- MN7001 Summative Assessment 2 Report Sample
- MBIS5011 Enterprise Systems Report 2 Sample
- ECUR207 Early Childhood Teacher Report Sample
- MBIS5012 Strategic Information Systems Report Sample
- MGT502 Business Communication Report 1A Sample
- MBIS5010 Professional Practice in Information Systems Essay 2 Sample
- MBA633 Real-world Business Analytics and Management Report 2 Sample
- CAS101 Community Development Report 2 Sample
- BULAW5916 Taxation Law and Practice Assignment Sample
- MBA600 Capstone Strategy Report 2 Sample
- HM6007 Statistics for Business Decisions/Statistics for Managers Assignment Sample
- SAP103 Introduction to Welfare Law 3B Essay Sample
- MBIS4009 Professional Practice in Information Systems Essay Sample
- CM801 Introduction to Risk Analysis Report 2 Sample
- TEC100 Introduction to Information Technology Report 2 Sample
- HWEL2006 Social and Emotional Wellbeing Case Study 3 Sample
- BUACC5931 Research and Statistical Methods for Business Assignment Sample
- BE485 Management and Strategy Report Sample
- OPS928 Logistics Systems Assignment Sample
- HNO6010 Recovery-Oriented Mental Health Research Report 2 Sample
- TO5103 Global Destination Competitiveness Report Sample
- SITHCC001 Use Food Preparation Equipment Assignment 2 Sample
- BUS5001 Ethical, Legal, and Industrial Frameworks Report Sample
- COMS1003 Culture to Cultures Report 1 Sample
- MITS5003 Wireless Networks and Communication Case Study Sample
- PSYC2017 Personality and Individual Differences Research Report Sample
- COIT20249 Professional Skills in Information Communication Technology Report2 Sample
- INT102 Assessment 1B Improving Communication with Vision-Impaired People Case Study Sample
- MBIS5014 Leading People in Digital Organisation Report 2 Sample
- PROJ6000 Principles of Project Management Report 1 Sample
- TECH5300 Bitcoin Report 2 Sample
- BUS101 Business Communication Essay 3 Sample
- NUR131 Research Foundations for Health Practice Case Study 2 Sample
- COIT20262 Advanced Network Security Report 2 Sample
- BUMGT6958 Comparative Issues in International Management Essay 1 Sample
- TCHR5003 Principles and Practices in Early Childhood Education Assignment Sample
- MIS605 Systems Analysis and Design Assignment 1 Sample
- TECH4100 UX and Design Thinking Report 2 Sample
- MBA6103 Agile Methodology Research Report 2 Sample
- MGT607 Innovation Creativity Entrepreneurship Case Study Sample
- Journal of Co-operative Organization and Management Sample
- Management Essay Sample
- ADM80012 Technology Management Report 2 Sample
- MEM601 Engineering Sustainability Report Sample
- ITCY603 Cyber Security Management Case Study Sample
- EDU30005 Understanding and Supporting Inclusion Report 2 Sample
- BUS5VA Visual Analytics Report 3 Sample
- MIS603 Microservices Architecture Case Study Sample
- EASC2702 Global Climate Change Report Sample
- MBA600 Capstone Strategy Essay 3 Sample
- ENEM20002 Fluid Power Engineering and Control Report Sample
- MLC707 Business Law Assignment Sample
- MGT605 Business Capstone Project Report 1 Sample
- MBIS4008 Business Process Management Report Sample
- SBU718 Strategic Leadership and Change Report 1 Sample
- M20467 Strategic Management Coursework Sample
- Information Security Assignment Sample
- PSY20016 Social Psychology Report 2 Sample
- MCR003 Management Attributes and Skills Report Sample
- Business Management Report Sample
- MBA505 Business Psychology Coaching and Mentoring Report Sample
- MBA622 Comprehensive Healthcare Strategies Report 1 Sample
- ISY503 Intelligent Systems Report Sample
- HI6032 Leveraging IT for Business Advantage Report 1 Sample
- NURBN2022 Case Study 3 Sample
- HI5029 IS Project Management Report Sample
- TCHR3001 Early Childhood Matters Report 2 Sample
- MANM399 International Accounting and Finance Project Report Sample
- ICT309 IT Governance Risk & Compliance Essay 2 Sample
- MGMT6009 Managing People and Teams Report 1 Sample
- 32144 Technology Research Preparations Report 2 Sample
- Journal Article Review Report 4 Sample
- MN691 Research Methods and Project Design Report Sample
- PRJ5108 Project Delivery and Procurement Case Study 4 Sample
- HT5005 Working as an Early Childhood Professional Essay Sample
- MIS611 Information Systems Capstone 3 A Report Sample
- PRJ5106 Research Methodology and Data Analysis Report 4 Sample
- BUS102 Management Principles Essay 2 Sample
- COIT20253 Business Intelligence using Big Data Report Sample
- MIS607 Cybersecurity Report 3 Sample
- MIS609 Data Management and Analytics Case Study 1 Sample
- DATA4900 Innovation and Creativity in Business Analytics Report 3 Sample
- ISYS1005 Systems Analysis and Design Report 3 Sample
- Health and Social Care in Emergencies and Disasters Report 3 Sample
- MBA404 Consumer Behaviour and Marketing Psychology Case Study 2 Sample
- MBA6204 Quantitative Support of Decision Making Report 2 Sample
- MN7002 International Business Strategy Report Sample
- PRJ5001 Project Management Profession Case Study 3 Sample
- NURS2023 Health of Adults Case Study 1 Sample
- MBA7101 Research Methods and Academic Skill Report 2 Sample
- PROJ6000 Principles of Project Management Report Sample
- ACF5956 Advanced Financial Accounting Report Sample
- MBA401 People, Culture and Contemporary Leadership Report 3 Sample
- MIS604 Requirements Engineering Case Study 1 Sample
- MBIS5013 Sustainability and Enterprise 4.0 Report 2 Sample
- DATA6000 Capstone Industry Case Studies Sample
- MBA673 Business Analytics Life Cycle Report 2 Sample
- ICC104 Introduction to Cloud Computing Report 3 Sample
- EDU40002 Play and Environment Report 2 Sample
- CCB102 Multimedia Design Report 1 Sample
- MBA621 Healthcare Systems Case Study 2 Sample
- BE969 Research Methods in Management and Marketing Sample
- STAT2009 Statistics for Managerial Decision Assignment Sample
- GDECE103 Language and Literacy in the Early Years Report 2 Sample
- MBA601 Fundamentals of Entrepreneurship Case Study 2 Sample
- MBA6204 Quantitative Support of Decision Making Report 3 Sample
- REM502 Research Methodologies Research Report 3 Sample
- MBA402 Governance, Ethics, and Sustainability 3B Report
- BUS5DWR Data Wrangling and R Report 3 Sample
- SOAD8014 Introduction to Australian Health and Human Services Essay 2 Sample
- AHS205 The Australian Healthcare System within a Global Context Report 2 Sample
- MKT600 Situation Analysis Report 1 Sample
- MEM602 Engineering Risk Management Report 1 Sample
- MIS609 Data Management and Analytics Case Study 3 Sample
- DATA4000 Introduction to Business Analytics Report 2 Sample
- ECE6012 Professional Practice Report 1 Sample
- AP501 Food, Fibre and Protein Report 4 Sample
- ACC602 Financial Accounting and Reporting Report 4 Sample
- MGT601 Dynamic Leadership Report 1 Sample
- TECH2400 Introduction to Cyber Security Report 2 Sample
- HM5003 Economics for Managers Assignment Sample
- HI6032 Leveraging IT for Business Advantage Report Sample
- AM906002 Corporate Governance Case Study 2 Sample
- NURBN2021 Nursing Essay Sample
- MGT602 Business Decision Analytics Report 3 Sample
- LML6002 Australian Migration Law Case Study 2 Sample
- MIS602 Data Modelling and Database Design Report 1 Sample
- MBA6001 Investment Management Report 2 Sample
- TCHR5009 Theory To Practice: Education and Care for Infants and Toddlers Report 1 Sample
- HCT343 Research Methods and Data Analysis Report Sample
- DSMG29001 Disaster Risk Reduction Report Sample
- DATA4400 Data-driven Decision Making and Forecasting Report 3 Sample
- PPMP20008 Initiating and Planning Projects Report 3 Part B Sample
- EMS5RCE Risk Engineering Report 2 Sample
- NUR2023 Pathophysiology, Pharmacology, and Nursing Management Case Study 2 Sample
- INFS2036 Business Intelligence Report 1 Sample
- TECH2400 Introduction to Cyber Security Report 3 Sample
- MG304 Agriculture Value Chain Management Case Study 2 Sample
- MGT604 Strategic Management Report 3 Sample
- BUA4003 Principles of Economics Assignment 2 Sample
- Recovery Nursing Care Plan Case Study Sample
- TECH2200 IT Project Management Case Study 1 Sample
- BSBOPS601 Develop and Implement Business Plan Diploma Sample
- ICT80011/40005 Energy Storage System Report Sample
- DATA4300 Data Security and Ethics Report 1 Sample
- MANM376 International Finance Project Report Sample
- GDECE104 Professional Teaching Practice 1 Report 2 Sample
- TECH2100 Introduction to Information Networks Report 2 Sample
- LB5234 Leading and Managing Organizational Change Report 2 Sample
- NURBN1012 Legal & Ethical Decision Making in Person Centred Care Sample
- MBA6301 Event Management Report 3 Sample
- PRJ5002 Enterprise and Resource Planning Case Study 4 Sample
- MIS610 Advanced Professional Practice Report 3 Part A Sample
- ACCM4400 Auditing and Assurance Report Sample
- ECTPP102A Play and Documentation Report Sample
- SWOT Analysis of Chanel No5 Perfume Marketing 4ps Report
- NURBN2023 Pathophysiology and Pharmacology Applied to Person-Centred Nursing Essay Sample
- MGNT803 Organisational Behaviuor and Management Report Sample
- MEM601 Engineering Sustainability Case Study 3 Sample
- DSMG29002 Leadership in Emergency and Disaster Management Report 2 Sample
- EBP107 Evidence-Based Practice Essay 3 Sample
- ICT707 Data Science Practice Report Sample
- Written Assessment Report 2 Sample
- HM5002 Finance for Managers Assignment Sample
- MGT613 Leadership for Sustainable Futures Report Sample
- HEAL5004 Strategic and Operational Health Services Management Report 3 Sample
- Finance Mini Case Study Sample
- MIS604 Requirement Engineering Report 1 Sample
- MBIS4008 Business Process Management Report 2A Sample
- ACC4001 Accounting Principles and Practices Assignment Sample
- MK400 Agribusiness Marketing Report 2 Sample
- ES5702 Planetary Health and Climate Change Report Sample
- Rich Picture CATWOE and Root Definition Report Sample
- WPDD202 Webpage Design and Development Report 4 Sample
- COIT20253 Business Intelligence using Big Data Report 1 Sample
- ENEG11005 Introduction To Contemporary Engineering Report Sample
- Group of People Holding Papers Discussing White Laptop White Background Sample
- ICT707 Data Science Practice Report 2 Sample
- FINM4100 Analytics in Accounting, Finance and Economics Report 2 Sample
- BST714 Strategic and Operational Decision-Making Assignment Sample
- SAP102 Welfare Systems and Services in Australia Report 1 Sample
- CAP203 Care of the person with an acute illness Case Study 2 Sample
- HI6038 Data Visualisation Assignment Sample
- HI6037 Business Analytics Fundamentals Assignment Sample
- TECH2200 IT Project Management Report 2 Sample
- MBA402 Governance, Ethics and Sustainability Report 2 Sample
- BUMGT6928 Developing Leader in Global Context Essay 3 Sample
- ACCT6006 Auditing Theory and Practice Case Study Sample
- HI6008 Business Research Report Sample
- BPM Final Assignment Sample
- PRJ5004 QRP Management Plan Report Sample
- MEE80003 Automation Strategy Case Study Sample
- FLD201 Ethics and Professional Practice Report Sample
- BUS5PB Principles of Business Analytics Report 1 Sample
- MBA5008 Business Research Methods Report Sample
- NURBN3030 Management of Deteriorating Patient Report Sample
- ADM80001 Nanofabrication Technologies Report Sample
- HI6008 Business Research Project Report Sample
- BUGEN5930 Business, Society and the Planet Report 1 Sample
- MGT602 Business Decision Analytics Report Sample
- PRJ6001 Applied Project Report 1 Sample
- MBA404 Consumer Behaviour and Marketing Psychology Report 1 Sample
- SOAD9226 Social Work with Groups and Communities Report Sample
- Australian Migration Law Assignment Sample
- BC400 Communication and Media Management Report Sample
- BIZ102 Understanding People and Organisations Report 3 Sample
- MBA6201 Quality Management Essay Sample
- MIS608 Agile Project Management Report 4 Sample
- MIS608 Agile Project Management Report 2 Sample
- SCQF Strategic Management Report Sample
- LB5403 Project Management Principles and Foundations Case Study 1 Sample
- BAO6504 Accounting For Management Report Sample
- Principles of Supply Chain Management Report Sample
- PSYC20039 Interdisciplinary and Cross-Cultural Approaches to Wellbeing Report Sample
- FIN600 Financial Management Case Study Sample
- LB5230 Managing Strategic Resources and Operations Report 3 Sample
- MCR006 Financial Management Assignment 3 Sample
- MBA5008 Business Research Methods Case Study 3 Sample
- MIS608 Agile Project Management Case Study 3 Sample
- DATA4000 Introduction to Business Analytics Case Study 1 Sample
- MBA643 Project Initiation, Planning and Execution Report Sample
- BRM5002 Intercultural Awarness for Business Report Sample
- OMGT2327 Distribution and Freight Logistics Case Study 1 Sample
- Social Media Audit Details Report Sample
- HDW204 Healthcare in the Digital World Report 1 Sample
- TECH2400 Introduction to Cyber Security Report 1 Sample
- MIS608 Agile Project Management Report 2 Sample
- Clinical Governance Essay 1 Sample
- LB5234 Leading and Managing Organisational Change Report Sample
- BUS5003 Information Systems and Data Analysis Case Study 2 Sample
- CS4417 Software Security Report Sample
- ECE306 Trauma Sensitive Practice and Well-being Report Sample
- HI6035 IS Governance and Risk Case Study Sample
- TCHR2002 Children, Families & Communities Report 1 Sample
- COS80025 Data Visualisation Report Sample
- CHM108 Introduction to Business Law Report 1 Sample
- MCR007 Understanding Project Management Essay 1 Sample
- MIT101 Introduction to Information Technology Report 3 Sample
- MBA623 Healthcare Management PPT Sample
- MEM604 Engineering Management Capstone Report 2 Sample
- ACCG8048 Ethics Theory Essay Sample
- CCS103A Counselling and Communication Skills Report Sample
- MBA613 Organisational Change and Innovation Case Study 3 Sample
- MBA631 Digital Marketing and Communication Report 1 Sample
- ICT504 IT Project Management Report 2 Sample
- MIS604 Requirement Engineering Report 3 Sample
- PLM Principles of Logistics Management Report Sample
- MBA633 Real-world Business Analytics and Management Case Study Sample
- MIS500 Foundations of Information Systems Report 1 Sample
- MGT600 Management People and Teams Report 1 Sample

 81 Isla Avenue Glenroy, Mel, VIC, 3046 AU


