BUS5PB Principles of Business Analytics Report 1 Sample
The Context
In the past two decades, the pharmaceutical, personal care, and nutritional industries have converged to address growing demands in the beauty, health, and wellness market. This convergence has resulted in the formation of the new industry segments – Nutraceuticals, Cosmeceuticals and Nutricosmetics.
.png)
• Cosmeceuticals: topical cosmetic products that have medicinal or drug-like benefits (creams and fortified syrups).
• Nutricosmetics: supplementation of nutrients that are formulated for beauty care (both oral and topical).
• Nutraceuticals: products derived from food sources that provide extra health benefits, in addition to the basic nutritional value found in food (dietary supplements and functional food).
These three new segments are mainly driven by an increasing awareness and need for preventive healthcare, natural therapies, and anti-aging products. The annual global growth rate of all three segments is approximately 4%–8%. A noticeable geographical dominance is observed in different segments – China and Japan are key Nutricosmetic markets accounting for 90% of global sales, while the USA dominates the Nutraceutical category at approximately 45%.
You have recently joined a start-up analytics consultancy firm as an Insights Specialist. The first task is to analyse the emergence of these industry segments in Australia. An end-user survey has been already conducted and the data is available for your perusal. Your line-manager has not laid out any specific The Survey
Are you a regular consumer of beauty, health and wellness products? (Data was only collected from regular consumers of beauty, health and wellness products.)
expectations; however, he has re-iterated the need to ‘understand these industry segments, consumers, the potential markets and opportunities’.
Your Tasks
Task 1:
Conduct a critical review of the survey and its outcomes. Suggest improvements to the survey in terms of data coverage and data metrics. You may refer to external sources of information to justify your evaluation.
Task 2:
Develop two analytics solutions to analyse the dataset using data visualisation software packages.
• You need to select either one of IBM Cognos or SAP Lumira as the first software to build the first visualization dashboard
• It’s mandatory to select Power BI as the second software package to build the second
visualization dashboard It is recommended to explore insights among data to pinpoint characteristics of each segment – for example, age or gender distribution for product type.
Task 3:
Based on the insights obtained from the analytics solutions and any external sources of information, recommend effective marketing strategies (market opportunities, targeted customers, channels for campaigns, etc.) for a potential client intending to enter these new industry segments in Australia. You need to decide on the number of recommendations with a brief justification for your choice.
Recommendations should refer to visualisations (a combination of diagrams and charts) from your analytics solutions and external references.
(Note: You are free to make reasonable assumptions and justifications given the educational nature of this case study.)
Solution
Introduction
For companies looking to succeed in this cutthroat market for beauty, health, and wellbeing in Australia, making well-informed decisions is essential. This research explores important findings from a large dataset and two different analytics tools, SAP Lumira and Microsoft Power BI. University Assignment Help, This research provides tactical advice to help potential market entrants in developing successful marketing strategies by looking at demographic aspects, product preferences, confidence ratings, and recommendation scores (Ashfaq et al., 2019). Understanding the subtleties of consumer behaviour and preferences is crucial, and this research offers practical insights to help businesses successfully enter new markets and enjoy sustained success in this always changing sector.
Task 1
In the market for beauty, health, and wellness, new industry categories including cosmeceuticals, nutricosmetics, and nutraceuticals have emerged as a result of the confluence of the pharmaceutical, personal care, and nutritional sectors. 360 frequent customers of beauty, health, and wellness goods were surveyed to get information on the market for these expanding areas in Australia. This article offers suggestions for improvements in terms of data coverage and data metrics while critically reviewing the survey and its findings. Only frequent buyers of items for beauty, health, and wellbeing were included in the poll (Ledley et al., 2020). This guarantees pertinent replies, but it could ignore potential customers who are not frequent users but would be intrigued by these new categories. Future surveys may incorporate a larger sample size to collect insights from a broader population in order to increase data coverage (Tavares et al., 2020). The poll disregards geographical differences throughout Australia. Urban and rural places might have quite different trends in beauty, health, and wellbeing. The survey should include respondents from several geographic locations in order to offer a more thorough insight. Because the revenue categories are so varied, it might be difficult to pinpoint precise spending habits (Pichler et al., 2019). These categories might be narrowed down into more specific ranges to offer more detailed insights on the spending patterns of various income levels.
The survey's broad age ranges might conceal variations in preferences and actions within each group. Analyzing how age affects product preferences might be made easier with a more detailed split of ages. The poll only provides two gender options, which could not accurately reflect the range of respondents' gender identities. Data accuracy would increase with a more open methodology and more gender alternatives (Usak et al., 2020). The poll requests respondents' preferred methods of communication, but it does not inquire as to how they like to be informed about health, wellness, and beauty items. The incorporation of this knowledge could improve marketing plans. Despite covering the three market groups, the poll falls short in its knowledge of the reasons why respondents are drawn to these items. It would be beneficial to include open-ended questions to better understand the motivations underlying respondents' product choices (Wolff et al., 2022). The spending preferences are grouped into broad categories that could not adequately reflect the subtle variations in desire to spend. It would be easier to determine price sensitivity and market prospects with a more thorough expenditure scale. The poll inquires about preferred consumption methods, such as pills, beverage, food, but it makes no attempt to understand the motivations underlying these decisions. Product development may be influenced by knowing what influences form choice. The confidence ratings are on a scale from 1 to 5, although to capture slight differences in confidence levels, a Likert scale with a wider range (like 1-10) may be more helpful (Neelam, Khatkar and Sharma, 2020). The study does not require respondents to provide justification for their assessments, which are given on a scale of 1 to 10. Deeper insights might be gained by including an open-ended question on the variables affecting recommendation ratings.
Include a more varied group of respondents in terms of age, income, region, and gender to improve data coverage and representativeness. area survey data analysis may help organizations customize their marketing and distribution strategies by revealing area trends and preferences. In order to get a better knowledge of spending patterns and age-related preferences, create more specific income and age groups (Eckelman et al., 2020). In order to guarantee a thorough grasp of the target audience, broaden the gender options to include all gender identities. Asking respondents about their favourite methods of acquiring information about cosmetic, wellness, and health items to help with marketing campaigns. In order to comprehend the underlying motives and factors influencing respondents' product preferences, include open-ended questions (Venil et al., 2020). By using a more thorough spending scale to more accurately assess price sensitivity and market prospects. In order to help with product development, ask respondents about the variables that affect their preferred mode of consumption. For evaluations of confidence and advice, use a wider Likert scale (like 1-10) to allow for more nuanced replies. The survey on new markets in Australia's beauty, health, and wellness industries offers insightful data on customer preferences and habits (Lenzen et al., 2020). On the other hand, there is opportunity for development in terms of data metrics and coverage. Future surveys can provide a more complete knowledge of the market by enlarging the demographics, enhancing categories, and include open-ended questions. Businesses in the nutraceuticals, cosmeceuticals, and nutricosmetics sectors will be able to better target their goods and marketing initiatives thanks to this improved data, which will eventually spur growth in these expanding industry areas.
Task 2
Analytics solution 1
Understanding customer preferences and behavior requires analyzing the dataset gathered from a study on developing beauty, health, and wellness market areas in Australia. The study uses SAP Lumira, a potent data visualization program, to draw conclusions from this data. This study will go through how to build a dashboard of visualizations and construct analytics solutions using SAP Lumira (Alves et al., 2020). In order to understand the characteristics of respondents and their preferences, the initial analytics solution will concentrate on demographic analysis. The researcher should adhere to the procedures outlined below to develop a dashboard for this study. Make sure the data is clean and well-structured before importing it into SAP Lumira. Make visuals that show how respondents are distributed by state, income, age range, and gender. In order to show these demographics, use geographic maps, bar charts, and pie charts. then examine which product categories are chosen by certain populations (Di Lorenzo et al., 2023). In order to see which product kinds are popular across states, income levels, age ranges, and genders, use stacked bar charts or heatmaps. Visualize expenditure patterns by income and age groups in the following step. In order to display the distribution of monthly product spending, create histograms or box graphs. In order to display the preferred communication channels for each demographic category, use donut charts or pie charts. Create drop-down menus and filters so users may interact with the dashboard. Users can choose a state or an age range, for instance, to get specific demographic insights.
.png)
Figure 1: Visualization Dashboard using SAP Lumira
(Source: Self-created using SAP Lumira)
The analytics solution, on the other hand, will concentrate on comprehending customer confidence and recommendation ratings for various product categories. The researcher should adhere to the procedures outlined below to develop a dashboard for this study. Make sure the confidence rating and recommendation score columns are appropriately classified before importing the dataset into SAP Lumira. In order to see the distribution of confidence ratings for each product type, make a line chart or scatter plot (de Souza et al., 2022). This will demonstrate the level of customer confidence in various goods. Analogous to confidence ratings, visualize recommendation scores. It might be easier to see which goods obtain higher recommendation scores using scatter plots or stacked bar charts. Compare the confidence rankings and recommendation scores for each responder using a scatter plot. This can show trends in consumer advocacy and trust (Badalyan et al., 2022). Include a filter that enables customers to choose a certain product type, allowing them to concentrate on particular product categories. If at all feasible, look for any relationships between suggestion, confidence, and other factors like income or age using trend lines or regression analysis. The research will obtain important insights from the survey data on expanding beauty, health, and wellness market segments in Australia by creating this analytics solution utilizing SAP Lumira. Demographic profiles, product preferences, confidence levels, and recommendation scores will all be shown in detail on this dashboard. In this developing industry, these data may guide product development and marketing initiatives.
Analytics solution 2
Microsoft Power BI provides a strong framework for constructing complete analytics solutions and building an intelligent dashboard in order to examine the dataset supplied. The study uses Power BI to analyze survey data on Australia's beauty, health, and wellness market categories to uncover important trends and insights. The analytics program can concentrate on demographic research. Power BI makes it simple to import and convert data, guaranteeing that the dataset is clear and correctly organized (Dini, 2023). It is possible to generate visualizations that show the distribution of respondents by state, income range, age range, and gender. In order to properly display these demographics, Power BI offers a variety of visual components, such as bar charts, pie charts, and regional maps. Additionally, Power BI's interactive capabilities let users dynamically filter and explore the data, giving them the option to choose particular states or age groups to discover in-depth demographic details.
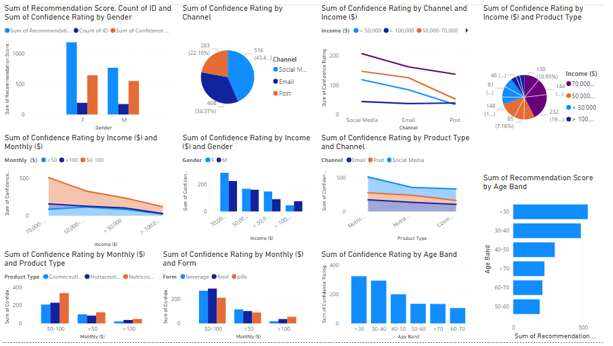
Figure 1: Visualization Dashboard using Power BI
(Source: Self-created using Power BI)
Analysis of product confidence and advice might be done using the analytics solution. The distribution of confidence ratings and recommendation scores for various product kinds may be seen using Power BI, which excels at handling numerical data. Heatmaps, line charts, and scatter plots may all be used to demonstrate which items have better recommendation scores and how confidence rating the consumers have in them (Michalak, 2022). Furthermore, Power BI permits the use of interactive components like filters and slicers, allowing users to concentrate on particular product categories or investigate relationships between confidence, recommendation ratings, and other characteristics like income or age. A flexible, user-friendly, and versatile framework for generating analytics solutions and producing an interactive dashboard of visualizations is provided by Microsoft Power BI. It is an effective tool for drawing conclusions that can be put into practice from the survey data in the beauty, health, and wellness sector dataset because of its capabilities for data translation, visualization, and interaction (Dini and Laneri, 2021). In this rapidly changing business, this dashboard may give stakeholders a clear picture of customer demographics, product preferences, and sentiment, enabling data-driven decision-making.
Task 3
The offered dataset and the analytics solutions made using SAP Lumira and Microsoft Power BI offer useful insights that help guide successful marketing plans for a possible customer wishing to penetrate the beauty, health, and wellness market segments in Australia. Following is a discussion of some recommendations based on the dataset. Based on variables including state, income, age, and gender, the demographic analysis indicates considerable variances in customer preferences. The client should target particular demographic groups with marketing efforts in order to successfully target buyers (Grzyb and Grzyb, 2021). For instance, social media might be the main platform for promoting cosmetics and nutricosmetics in areas like Queensland and South Australia, where there is a significant presence of younger customers (<30). For elderly customers (>70), however, email and postal mail may be more efficient ways to spread information on dietary supplements. The data shows how popular certain product categories are across populations. Understanding these preferences might help direct marketing and product development initiatives. For instance, customers under the age of 30 tend to choose medicines, whereas consumers over the age of 70 tend to favour liquids and food items. This data may be used by the client to create and market items that fit these tastes. Depending on the demographic category, many communication methods are available. Younger customers prefer social media, whereas elderly consumers choose email and postal letters (Meléndez-Martínez et al., 2019). Reach and engagement may both be increased by channel-specific marketing messaging. Running social media campaigns for younger demographics and email newsletters for older populations, for instance, can be successful strategies.
Building trust and loyalty requires an understanding of customer confidence and recommendation ratings. The client should concentrate on and create marketing campaigns for the goods that obtain high recommendation scores. Putting the focus on good customer feedback and experiences may be an effective tactic. The customer may set competitive prices for their items by examining spending trends based on income and age groupings. For instance, individuals in the 70,000–90,000 income range appear to spend more money on goods, particularly those priced between $50 and $100. The customer can utilize this data to choose the best price plans. The customer can locate areas with a greater consumer density and prospective market prospects using geographic maps. They might concentrate their marketing efforts in regions with a high customer presence (Khan et al., 2019). The dashboards' use of drop-down menus and filters enables users to interact with the data and derive targeted insights. The client's marketing team may utilize this capability to research various demographic groups and adjust plans as necessary. These analytics tools should be used by the customer as part of a continuous monitoring procedure. The study should be updated on a regular basis to assist the client stay ahead in the competitive beauty, health, and wellness industry because consumer tastes and trends might change over time. A solid basis for successful marketing strategies in the Australian beauty, health, and wellness sector may be built on the dataset and analytics solutions' mix of demographic information, product preferences, confidence ratings, and recommendation scores (Rasyid et al., 2021). The customer may increase their chances of success in this cutthroat market by focusing on the proper demographics, employing preferred communication methods, and promoting items with high recommendation ratings. Long-term success in this quickly expanding market will also depend on maintaining a close eye on changing trends and consumer behaviour.
Conclusion
Businesses in Australia have both possibilities and problems due to the country's dynamic beauty, health, and wellness sector. Using the extensive dataset and analytics tools like SAP Lumira and Microsoft Power BI, insights were produced that shed light on important facets of consumer behavior and preferences. Potential market participants may strategically modify their marketing strategies in light of this knowledge to successfully negotiate the challenging competitive environment. The significance of demographic targeting, matching product offers to consumer interests, and keeping a laser-like focus on fostering customer pleasure and trust through confidence ratings and recommendation scores are some of the key lessons. Businesses may position themselves for effective market entry and sustained growth in this dynamic sector with the help of these practical insights.
Reference List
Alves, A., Sousa, E., Kijjoa, A. and Pinto, M., 2020. Marine-derived compounds with potential use as cosmeceuticals and nutricosmetics. Molecules, 25(11), p.2536.
Ashfaq, M., Li, Y., Rehman, M.S.U., Zubair, M., Mustafa, G., Nazar, M.F., Yu, C.P. and Sun, Q., 2019. Occurrence, spatial variation and risk assessment of pharmaceuticals and personal care products in urban wastewater, canal surface water, and their sediments: A case study of Lahore, Pakistan. Science of the Total Environment, 688, pp.653-663.
Badalyan, S.M., Barkhudaryan, A. and Rapior, S., 2022. Medicinal macrofungi as cosmeceuticals: A review. International Journal of Medicinal Mushrooms, 24(4).
de Souza, A.F., Lins, M.C.M., de Lima, M.A.B., da Silva Andrade, R.F., Rodríguez, D.M., Gusmão, N.B. and de Campos-Takaki, G.M., 2022. Eco-friendly production of nutraceutical and cosmeceutical fatty acids by oleaginous fungus Lichtheimia hyalospora UCP 1266 using renewable substrates. Research, Society and Development, 11(8), pp.e28811830753-e28811830753.
Di Lorenzo, R., Grumetto, L., Sacchi, A., Laneri, S. and Dini, I., 2023. Dermocosmetic evaluation of a nutricosmetic formulation based on Curcuma. Phytotherapy Research, 37(5), pp.1900-1910.
Dini, I. and Laneri, S., 2021. The new challenge of green cosmetics: Natural food ingredients for cosmetic formulations. Molecules, 26(13), p.3921.
Dini, I., 2023. The Potential of Algae in the Nutricosmetic Sector. Molecules, 28(10), p.4032.
Eckelman, M.J., Huang, K., Lagasse, R., Senay, E., Dubrow, R. and Sherman, J.D., 2020. Health Care Pollution And Public Health Damage In The United States: An Update: Study examines health care pollution and public health damage in the United States. Health Affairs, 39(12), pp.2071-2079.
Grzyb, J. and Grzyb, S., 2021. Comprehensive skin care with cosmetic preparations, dietary supplements and functional food. Aesthetic Cosmetology and Medicine, 10(6), pp.293-297.
Khan, M.K., Paniwnyk, L. and Hassan, S., 2019. Polyphenols as natural antioxidants: sources, extraction and applications in food, cosmetics and drugs. Plant Based “Green Chemistry 2.0” Moving from Evolutionary to Revolutionary, pp.197-235.
Ledley, F.D., McCoy, S.S., Vaughan, G. and Cleary, E.G., 2020. Profitability of large pharmaceutical companies compared with other large public companies. Jama, 323(9), pp.834-843.
Lenzen, M., Malik, A., Li, M., Fry, J., Weisz, H., Pichler, P.P., Chaves, L.S.M., Capon, A. and Pencheon, D., 2020. The environmental footprint of health care: a global assessment. The Lancet Planetary Health, 4(7), pp.e271-e279.
Meléndez-Martínez, A.J., Stinco, C.M. and Mapelli-Brahm, P., 2019. Skin carotenoids in public health and nutricosmetics: The emerging roles and applications of the UV radiation-absorbing colourless carotenoids phytoene and phytofluene. Nutrients, 11(5), p.1093.
Michalak, M., 2022. Plant-derived antioxidants: Significance in skin health and the ageing process. International journal of molecular sciences, 23(2), p.585.
Neelam, Khatkar, A. and Sharma, K.K., 2020. Phenylpropanoids and its derivatives: biological activities and its role in food, pharmaceutical and cosmetic industries. Critical reviews in food science and nutrition, 60(16), pp.2655-2675.
Pichler, P.P., Jaccard, I.S., Weisz, U. and Weisz, H., 2019. International comparison of health care carbon footprints. Environmental research letters, 14(6), p.064004.
Rasyid, A., Yasman, Y. and Putra, M.Y., 2021. Current prospects of nutraceutical and pharmaceutical use of sea cucumbers. Pharmacia, 68(3), pp.561-572.
Tavares, M., Kozak, M., Balola, A. and Sá-Correia, I., 2020. Burkholderia cepacia complex bacteria: a feared contamination risk in water-based pharmaceutical products. Clinical microbiology reviews, 33(3), pp.10-1128.
Usak, M., Kubiatko, M., Shabbir, M.S., Viktorovna Dudnik, O., Jermsittiparsert, K. and Rajabion, L., 2020. Health care service delivery based on the Internet of things: A systematic and comprehensive study. International Journal of Communication Systems, 33(2), p.e4179.
Venil, C.K., Dufossé, L. and Renuka Devi, P., 2020. Bacterial pigments: sustainable compounds with market potential for pharma and food industry. Frontiers in Sustainable Food Systems, 4, p.100.
Wolff, J., Pauling, J., Keck, A. and Baumbach, J., 2020. The economic impact of artificial intelligence in health care: systematic review. Journal of medical Internet research, 22(2), p.e16866.
Fill the form to continue reading
Would you like to schedule a callback?
Send us a message and we will get back to you


Highlights
Earn While You Learn With Us
Confidentiality Agreement
Money Back Guarantee
Live Expert Sessions
550+ Ph.D Experts
21 Step Quality Check
100% Quality
24*7 Live Help
On Time Delivery
Plagiarism-Free

 81 Isla Avenue Glenroy, Mel, VIC, 3046 AU


