MIS775 Decision Modelling for Business Analytics Report Sample
Description
Purpose
This assignment task is aligned to the learning outcomes GLO1 & ULO1 and skills GLO4 & ULO3 and GLO5 & ULO2 required to build complex decision models and use advanced quantitative modelling techniques, such as optimization, to analyses and develop solutions to business problems. By completing this task, you will develop your skills in conceptualizing, formulating and representing a business problem as a decision model, developing business decision models using software tools, undertaking sensitivity analysis and evaluating the utility of alternative solutions.
Context/Scenario
This assignment is designed to let you explore and evaluate a number of approaches to investment portfolio optimisation, using live real-world data. The relevant URL for finding stock prices is: https://au.finance.yahoo.com/ via the “Quote lookup” search box.
In this assignment you will use asset return data for a period of 3 years to identify the optimum portfolio by applying a range of optimisation methods. In each case you must determine the percentage (or proportion) of the portfolio to invest in each of 10 assets, such that the percentages are non-negative and sum to 100% (or 1). You will then compare the performance of these portfolios on a further 1 year of data, so that you may observe just how well the optima generated from the first three years of data performed in that subsequent period, by comparison with the optimum portfolios for that period. This will allow you to make some assessment about the validity for future investment decisions of the optimisation methods which just use past data.
Specific Requirements
The assignment has three main sections: Preliminary Work, Optimisation Models; and Validation and Report.
The requirements of each section are detailed below. The breakdown of marks (total of 40) is given in this document and the Assignment 1 Rubric.
Section 1: Preliminary Work (4 marks)
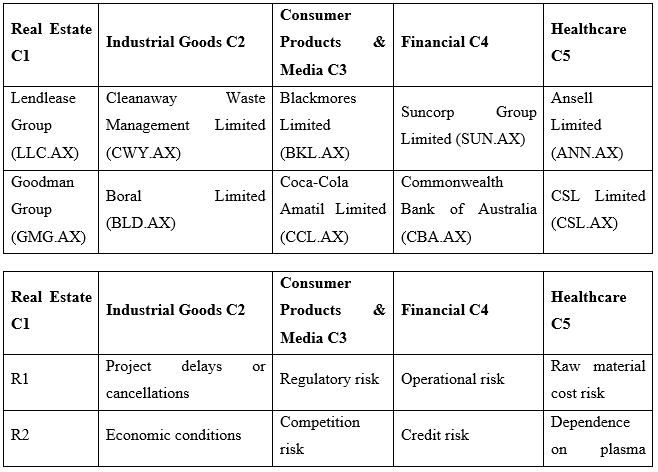
Choose five investments listed on the Australian Stock Exchange, one from each of the given in the following table, to complete a set of 10 investments..
.png)
To access the Stocks, click Industries on the ribbon menu (via the home page), and select a category. Then click on the symbol for the asset you want to include in your portfolio. After you have selected a Stock, click Historical data on the ribbon menu, then set Time period to 1 February 2019 – 28 February 2023 and Frequency to Monthly, then press the Apply button, and download the data. Delete any rows showing dividends. We are only interested in the opening price, listed in the column headed Open. Discard the rest of the data.
The chosen stocks must satisfy the following general requirements:
• Each have 49 consecutive months of opening prices, up to and including 1 February 2023.
• They should be selected from the five industry categories (C1 to C5) listed in the table above, namely Real Estate, Industrial Goods, Consumer Products & Media, Financial, and Healthcare. You must choose only one asset from each of these five categories.
• For each of the 10 assets (i.e., the five given assets and the five you chose), calculate monthly returns, average return and then use their standard deviation to find their risk.
• The 10 assets should span a reasonable range of volatilities/risk. For this reason, you might try several assets in a category before settling on a final choice.
• Classify each of the 10 assets (i.e. the five given stocks and the five you chose) into one of four risk groups R1, R2, R3, and R4, where R1 < R2 < R3< R4. It is up to you to determine the basis for the risk classification, but you must have at least two assets in each risk group.
• Each asset must belong to one of the five industry categories and one of the four risk categories. See below template. Once you determined what risk group they belong to, you can write the asset/company name in the body of the table below.
.png)
The collected data needs to be divided into two sets:
• Modelling data: For your portfolio optimisations, you should use the first 37 months of data. Perform parts 1, 2, 3a, 3b and 3c on the modelling data (or Training set).
• Holdout sample: The last 12 month of collected data. This is to assess model performance as a means of model validation. Perform parts 1, 2, 3a, 3b and 3c again using Holdout sample. This is called validation task. In validation part, you should include the results of this comparison in a table.
Section 2: Optimisation Models (20 marks)
For your portfolio optimisations, you should use modelling data to undertake parts 1, 2, 3a, 3b, and 3c.
The assignment requires you to consider three different approaches to portfolio optimisation:
1. Choosing according to asset class restrictions, and individual asset risk appetite.
2. Choosing according to portfolio size restrictions and risk appetite.
3. Choosing according to portfolio risk and return requirements.
These three approaches allow exploration of three different optimisation techniques:
Solution
Section 1: Preliminary Work
The investigation focuses on 10 businesses that are listed in the stock exchange of Australia from 5 industry sectors. The sectors are real estate, consumer goods and media, financial sector, healthcare sector and industrial sector (Rabi, et al. 2020). University Assignment Help, Two companies are selected from each sector, one was shortlisted and one was chosen from each category. Lendlease group and Goodman group are real estate companies whereas Goodman Group is a major real estate group while Lendlease is a multinational construction and real estate company. Goodman group has offices across Europe, Asia Pacific and North America and Lendlease group has offices in Australia, Europe, Asia Pacific and America. The risk of project delay or cancellation are one of the major threat for Lendlease group. Due to the involvement of companies in large number of building projects and any cancellation might result its performance or reputation negatively. Economic situation of the Goodman group is at a major risk because of the interest rates and consumers sentiments as well as the growth rate in gross domestic product.
.png)
Table 1: Risk metrics
(Source: Created by author)
Meanwhile, the Commonwealth Bank of Australia (CBA.AX) is facing regulatory challenges. Banking is a heavily regulated industry, and regulatory changes can have a considerable impact on business operations and profitability. Ansell Limited (ANN.AX) bears risks connected to product recalls and clinical trial hazards in the healthcare sector. The company makes and sells a variety of healthcare items such as surgical gloves, contraceptives, and protective apparel (Boldog, et al. 2020). Defects in these items, as well as unfavourable patient outcomes, can lead to product recalls and significant financial losses for the company. Furthermore, the corporation is involved in a number of clinical trials, which expose it to risks related to the safety and efficacy of the products under consideration. Noncompliance with regulatory standards, negative consequences, and adverse patient effects are examples of these risks. The Australian Securities Exchange selected ten companies from a variety of industries, including real estate, manufacturing, consumer goods, media, finance, and healthcare. These companies confront numerous risks, including regulatory, economic, operational, credit, market, liquidity, concentration, environmental, and clinical trial issues. Investors should consider these risks while making investment decisions and diversify their portfolios to limit their impact.
Section 2: Optimization Models
The application of using data modeling is effective in dealing with the factor. Composing of relation with the data integrated within the section. The application of different modeling integrated, it has reflected the overall scenario for suggesting the approaches. Application of overall factor is proposed for considering the scenario.
1. LP model
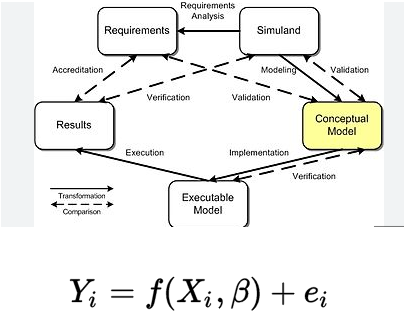
The statistical output has mainly been preferred in evaluating the overall performance for dealing with the activities. Suggesting the implication can be integrated for responding in developing the scenario. Highlighting of value is further proposed for suggesting the overall evaluation system. Consideration of involvement is further proposed for approaching the scenario. Evaluation within the system is also considered for explaining the overall scenario. Application of this model has been used for making forecasting the data. Application of linear regression model that has applied in proposing the overall factor. Integration of the model is basically used for decision-making variable definition.
.png)
Figure 1: Presentation of graph
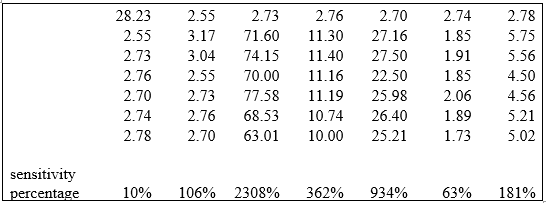
It has initiated the sensitivity analysis for developing the overall factor. The consideration of the scenario has been defined within the factor for controlling the factor. The selected stock scenario, it is mainly highlighted the overall situation with the data given (Paltrinieri et al. 2019). The objective of this linear programming (LP) model is to maximize overall return on investment within a set of defined risk and category limitations. It places reasonable constraints on risk categories (R1 to R4) and asset categories (C1 to C5) in order to maintain a broad and well-balanced portfolio. Once the LP model has been created, the best solution can be discovered using a suitable solver, such as the Simplex algorithm or an interior-point technique. Given the limitations, the solution will output the asset allocation that maximizes the overall return.
To comprehend how changes in risk and category limits affect the ideal portfolio, perform a sensitivity analysis. This research shows how the best solution could change depending on whether the limitations are tightened or loosen.
2. ILP model
.png)
Figure 2: Risk analysis
The application of ILP model is applied to explore the actual return value with the selected return. It has chosen the stock value and return factor for exploring the overall situation. Identification within the scenario has been defined as the actual scenario for the process (Chakraborty and Ghosh, 2020). Integration of process is also included for proposing the overall reflection
.png)
Figure 3: Risk analysis
The analysis of statistical review has explained the overall responses from the market which is evaluating the overall scenario. The consideration of statistical exposure has defined the overall situation for the data provided.
Sensitivity report
Conceptual model
3. NLP model
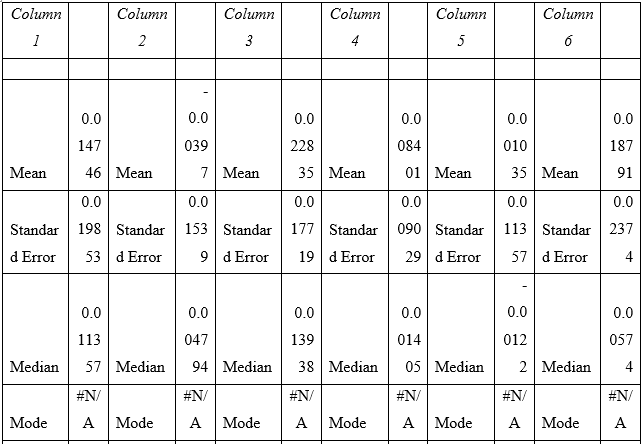
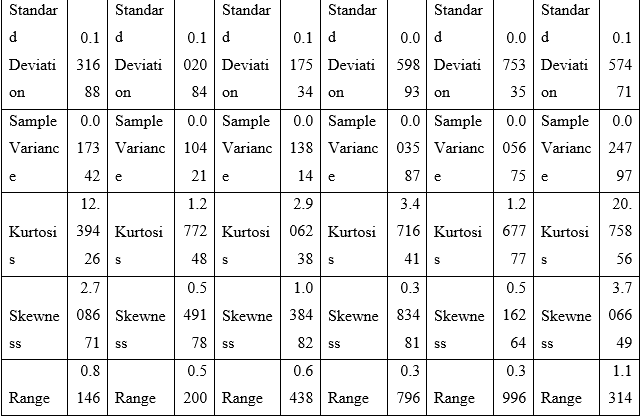
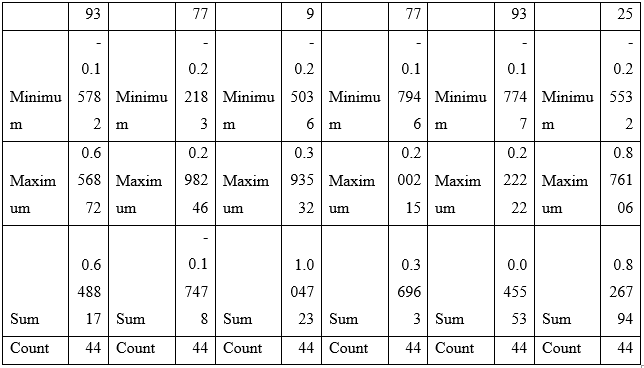
Table 1: Descriptive statistics
The aim of the factor for proposing the optimizing the risk scenario. Suggesting integrated approaches can be revealed for highlighting the actual scenario. It has considered several risk integration approaches that can deal with the factor (Bet et al. 2019). Proposing the scenario can be highlighted for focusing on the factor.
Reference
Bet, P., Castro, P.C. and Ponti, M.A., 2019. Fall detection and fall risk assessment in older person using wearable sensors: A systematic review. International journal of medical informatics, 130, p.103946.
Boldog, P., Tekeli, T., Vizi, Z., Dénes, A., Bartha, F.A. and Röst, G., 2020. Risk assessment of novel coronavirus COVID-19 outbreaks outside China. Journal of clinical medicine, 9(2), p.571.
Chakraborty, T. and Ghosh, I., 2020. Real-time forecasts and risk assessment of novel coronavirus (COVID-19) cases: A data-driven analysis. Chaos, Solitons & Fractals, 135, p.109850.
EFSA Scientific Committee, More, S.J., Bampidis, V., Benford, D., Bennekou, S.H., Bragard, C., Halldorsson, T.I., Hernández?Jerez, A.F., Koutsoumanis, K., Naegeli, H. and Schlatter, J.R., 2019. Guidance on harmonised methodologies for human health, animal health and ecological risk assessment of combined exposure to multiple chemicals. Efsa journal, 17(3), p.e05634.
Paltrinieri, N., Comfort, L. and Reniers, G., 2019. Learning about risk: Machine learning for risk assessment. Safety science, 118, pp.475-486.
Rabi, D.M., McBrien, K.A., Sapir-Pichhadze, R., Nakhla, M., Ahmed, S.B., Dumanski, S.M., Butalia, S., Leung, A.A., Harris, K.C., Cloutier, L. and Zarnke, K.B., 2020.
Hypertension Canada’s 2020 comprehensive guidelines for the prevention, diagnosis, risk assessment, and treatment of hypertension in adults and children. Canadian Journal of Cardiology, 36(5), pp.596-624.
Fill the form to continue reading
Would you like to schedule a callback?
Send us a message and we will get back to you
Main Services
- Accounting Assignment Help
- Accounting Assignment Helper
- Accounting Case Study Assignment Help
- Accounting Essay Help
- Assignment Help Adelaide
- Assignment Help Auckland
- Assignment Help Ballarat
- Assignment Help Bendigo
- Assignment Help Birmingham
- Assignment Help Brisbane
- Assignment Help Bristol
- Assignment Help Calgary
- Assignment Help Canberra
- Assignment Help Darwin
- Assignment Help Dubai
- Assignment Help Dublin
- Assignment Help Geelong
- Assignment Help Gold Coast
- Assignment Help Griffith
- Assignment Help Hamilton
- Assignment Help Hobart
- Assignment Help Liverpool
- Assignment Help London
- Assignment Help Manchester
- Assignment Help New York
- Assignment Help Newcastle
- Assignment Help Oxford
- Assignment Help Perth
- Assignment Help Sydney
- Assignment Help Toowoomba
- Assignment Help Toronto
- Assignment Help Wellington
- Assignment Writing Help
- AU
- Auditing Assignment Help
- Biology Assignment Help
- Bond University Assignment Help
- Business Accounting Assignment Help
- Buy Research Paper
- CA
- Case Study Help
- Corporate Accounting Assignment Help
- Cost Accounting Assignment Help
- Coursework Writing Help
- Curtin University Assignment Help
- Deakin University Assignment Help
- Dissertation Writing Help
- Do My Accounting Assignment
- Do My Accounting Papers
- Do My Finance Assignment
- Economics Assignment Help
- Engineering Assignment Help
- Essay Writing Help
- Federation University Assignment Help
- Finance Assignment Help
- Financial Planning Assignment Help
- Flinders University Assignment Help
- Holmes Institute Assignment Help
- Humanities Assignment Help
- IT Assignment Help
- JCU Assignment Help
- Kaplan Business School Assignment Help
- La Trobe University Assignment Help
- Law Assignment Help
- Leader Institute Assignment Help
- Management Assignment Help
- Managerial Accounting Assignment Help
- Mathematics Assignment Help
- Monash University Assignment Help
- MY
- Nursing Assignment Help
- NZ
- PIA University Assignment Help
- Programming Assignment Help
- Queensland University of Technology Assignment Hel
- Research Paper Help
- Research Paper Writers
- Research Paper Writing Help
- Research Paper Writing Service
- RMIT University Assignment Help
- Science Assignment Help
- SG
- Swinburne University of Technology Assignment Help
- Thesis Writing Help
- UAE
- UK
- UNSW Assignment Help
- US
- Victoria University Assessment Help
- VIT University Assignment Help
- Write My Assignment
- Write My Research Paper


Highlights
Earn While You Learn With Us
Confidentiality Agreement
Money Back Guarantee
Live Expert Sessions
550+ Ph.D Experts
21 Step Quality Check
100% Quality
24*7 Live Help
On Time Delivery
Plagiarism-Free
Our Samples
- MAC002A Accounting Information Systems Report Sample
- HWEL2006 Social and Emotional Wellbeing Case Study 3 Sample
- MBA600 Capstone Strategy Report 2 Sample
- HSV3245 Contemporary Mental Health Practice Report 3 Sample
- HDW204 Healthcare in the Digital World Report 2 Sample
- DSMG29002 Leadership in Emergency and Disaster Management Report 2 Sample
- Written Assessment Report 2 Sample
- HI6038 Data Visualisation Assignment Sample
- COIT20249 Professional Skills in Information Communication Technology Report2 Sample
- BUMKT5902 Marketing Mix Strategy Report Sample
- ES5702 Planetary Health and Climate Change Report Sample
- PPMP20007 Project Management Concept Report Sample
- PSY20016 Social Psychology Report 2 Sample
- NURBN3030 Management of Deteriorating Patient Report Sample
- EC501 International Economic Development Report 1 Sample
- MGT501 Business Environment Report Sample
- BUS600 Organisational Behaviour and Leadership Report 2 Sample
- TECH2400 Introduction to Cyber Security Report 3 Sample
- PUBH6008 Capstone A Applied Research Project in Public Health Report Sample
- PSYC20042 Psychology, Wellbeing, and Resilience Website Blog Report 2 Sample
- ECUR302 Mathematics in the Early Years Report Sample
- PUBH1425 Life History and Determinants of Health Report Sample
- UNCC300 Justice and Change in a Global World Report 2 Sample
- TECH2100 Introduction to Information Networks Report 1 Sample
- DATA4300 Data Security and Ethics Report 1 Sample
- DATA4000 Introduction to Business Analytics Report 2 Sample
- ISYS1005 Systems Analysis and Design Report 3 Sample
- MGT502 Business Communication Report 1A Sample
- DHI401 Digital Health and Informatics Report 2 Sample
- MBA504 Introduction to Data Analytics for Business Case Study 2 Sample
- MITS5003 Wireless Networks and Communication Case Study Sample
- BULAW5916 Taxation Law and Practice Assignment Sample
- MBIS4008 Business Process Management Report Sample
- ECTPP102A Play and Documentation Report Sample
- BM303 Contemporary Issues in Agribusiness Production and Management Case Study Sample
- MGT607 Innovation Creativity Entrepreneurship Case Study Sample
- TECH2200 IT Project Management Report 2 Sample
- MEE80003 Automation Strategy Case Study Sample
- MBA6001 Investment Management Report 2 Sample
- Principles of Economics Assignment Sample
- NURBN2021 Nursing Essay Sample
- BUMGT6973 Project Management Case Study Sample
- TEC100 Introduction to Information Technology Report 2 Sample
- OPS911 Strategic Procurement Management Report Sample
- MITS4004 IT Networking and Communication Report Sample
- MBA402 Governance, Ethics and Sustainability Report 2 Sample
- MECO6912 Political Public Relations Report 1 Sample
- CPO442 Cybersecurity Principles and Organisational Practice Report 2 Sample
- MIS602 Data Modelling and Database Design Report 1 Sample
- MIS607 Cybersecurity Report 3 Sample
- Social Media Audit Details Report Sample
- MOB6110 Creating Entrepreneurial Leaders Report Sample
- CCB102 Multimedia Design Report 1 Sample
- LB5234 Leading and Managing Organisational Change Report Sample
- MIS609 Data Management and Analytics Case Study 3 Sample
- GDECE101 Early Childhood Care and Education Report Sample
- MBIS5011 Enterprise Systems Report 2 Sample
- NUR2023 Pathophysiology, Pharmacology, and Nursing Management Case Study 2 Sample
- ICT606 Machine Learning Report Sample
- TECH2400 Introduction to Cyber Security Report 2 Sample
- MBIS5009 Business Analytics Report Sample
- ACC202 Contemporary Financial Accounting Report Sample
- PROJ6000 Principles of Project Management Report 1 Sample
- OPS802 Operations Management of Subway Research Report 4 Sample
- TECH2300 Service and Operations Management in IT Case Study 2 Sample
- MBIS5013 Sustainability and Enterprise 4.0 Report 3 Sample
- SCQF Strategic Management Report Sample
- MBA600 Capstone Strategy Essay 3 Sample
- HI5031 Professional Issues in IS Ethics and Practice Case Study Sample
- EDU20014 Social and Emotional Learning Report Sample
- MIS603 Microservices Architecture Case Study Sample
- OPS909 Total Quality Management Report Sample
- Journal Article Review Report 4 Sample
- PRJ5001 Project Management Profession Case Study 3 Sample
- PRJ5002 Enterprise and Resource Planning Case Study 4 Sample
- SAP103 Introduction to Welfare Law 3B Essay Sample
- BUGEN5930 Business, Society and the Planet Report 1 Sample
- HM5002 Finance for Managers Assignment Sample
- Management Essay Sample
- LAW6001 Taxation Law Case Study Sample
- HS7000 Information Systems in Business Research Report Sample
- HI6034 Enterprise Information Systems Report Sample
- Personal Improvement Plan Report Sample
- PSYC20036 Applied Positive Psychology Essay Sample
- FE7066 Data Analysis for Global Business Coursework Sample
- PROJ-6012 Managing Information Systems, Technology Report Sample
- MGT602 Business Decision Analytics Report 3 Sample
- ITCY603 Cyber Security Management Case Study Sample
- MBA6301 Event Management Report 3 Sample
- TECH4100 UX and Design Thinking Report 2 Sample
- COIT20253 Business Intelligence using Big Data Report 1 Sample
- MIS608 Agile Project Management Case Study 3 Sample
- HI5004 Marketing Management Case Study Sample
- MBIS5013 Sustainability and Enterprise 4.0 Report 2 Sample
- ECE6012 Professional Practice Report 1 Sample
- BUACC5931 Research and Statistical Methods for Business Assignment Sample
- TECH8000 IT Capstone Report 1 Sample
- MBA6104 Business Process Modelling & Management Report Sample
- EDU20014 Social and Emotional Learning Report Sample
- ICC104 Introduction to Cloud Computing Report 2 Sample
- GDECE102 Learning and Development Birth To Two Years Report 1 Sample
- SAP101 Foundations of Sociology and Politics for Community Services Workers Essay 2 Sample
- BUS5103 Marketing and Communication Essay 2 Sample
- MBA623 Healthcare Management PPT Sample
- IM401 Introduction to Agroinformatics Report Sample
- CWB103 Interpersonal and Intercultural Negotiation Assessment 1 Sample
- MK400 Agribusiness Marketing Report 2 Sample
- COMS1003 Culture to Cultures Report 1 Sample
- NURS2023 Health of Adults Case Study 1 Sample
- BUS5001 Ethical, Legal, and Industrial Frameworks Report Sample
- INT103 Human Development Across the Lifespan Report 2 Sample
- FLD201 Ethics and Professional Practice Report Sample
- PROJ6000 Principles of Project Management Report Sample
- ICT5151 Data and Information Management Report 4 Sample
- MBA643 Project Risk, Finance, and Monitoring Report 3 Sample
- BC400 Communication and Media Management Report Sample
- GAL613 Grief and Loss Essay Sample
- CAS101 Community Development Report 2 Sample
- ECE6003 Contemporary Issues, Social Contexts of Learning and Social Justice Sample
- BUA4003 Principles of Economics Assignment 2 Sample
- EMS5RCE Risk Engineering Report 2 Sample
- CA7013 Sustatnability in Global Companies 2022-23 Report
- MEM604 Engineering Management Capstone Report 2 Sample
- BUS6302 Integrated Marketing Communications Report 1 Sample
- MBA600 Capstone Strategy Essay 3 Sample
- MBA6204 Managing the Quantitative Support of Decision Making Report 2 Sample
- MEM602 Engineering Risk Management Report 1 Sample
- PSYC2017 Personality and Individual Differences Research Report Sample
- ACCT6007 Financial Accounting Theory and Practice Report 2 Sample
- DATA4400 Data-driven Decision Making and Forecasting Report 3 Sample
- NURBN3033 Primary Health Report Sample
- MBA6302 Integrated Marketing Communications Report Sample
- MBA601 Fundamentals of Entrepreneurship Case Study 2 Sample
- MIS611 Information Systems Capstone 3 A Report Sample
- BLCN29001 Construction Technology Report Sample
- HI5030 Systems Analysis and Design Case Study Sample
- TECH5300 Bitcoin Report 2 Sample
- SOAD9226 Social Work with Groups and Communities Report Sample
- STAT2009 Statistics for Managerial Decision Assignment Sample
- MBA5008 Business Research Methods Report Sample
- EDES300 Comparative Education Report 3 Sample
- BUS5VA Visual Analytics Report 3 Sample
- HI5017 Managerial Accounting Report Sample
- 32144 Technology Research Preparations Report 2 Sample
- CCS103A Counselling and Communication Skills Report Sample
- LML6002 Australian Migration Law Case Study 2 Sample
- MIS604 Requirement Engineering Report 3 Sample
- MBA7101 Research Methods and Academic Skill Report 2 Sample
- Marketing Assignment Writing Sample
- DSMG29001 Disaster Risk Reduction Report Sample
- MBAS906 Business Analytics Research Capstone Research Report 1 Sample
- BUS102 Management Principles Essay 2 Sample
- Impact of Green Supply Chain Management on The Profitability of The Retail Industry Sample
- COIT20248 Information Systems Analysis & Design Report 1 Sample
- PRJ5106 Research Methodology and Data Analysis Assignment 2 Sample
- TCHR5009 Theory To Practice: Education and Care for Infants and Toddlers Report 1 Sample
- AP501 Food, Fibre and Protein Report 4 Sample
- TCHR3004 Leadership and Advocacy in Early Childhood Report 1 Sample
- Local Government Area LGA Essay 2 Sample
- Strategic and Operating Health Management Report 2 Sample
- ICT101 Discrete Mathematics Report 3 Sample
- PUBH6008 Capstone A Applied Research Project in Public Health Report 2 Sample
- EDU10005 Indigenous Education and Perspectives Essay 2 Sample
- DATA4600 Business Analytics Project Management Case Study 1 Sample
- OPS910 Linear Programming Assignment Sample
- Rich Picture CATWOE and Root Definition Report Sample
- HCCSSD104 Lifespan Development Report 3 Sample
- EDU30005 Understanding and Supporting Inclusion Report 2 Sample
- Finance Mini Case Study Sample
- TO5103 Global Destination Competitiveness Report Sample
- INT102 Assessment 1B Improving Communication with Vision-Impaired People Case Study Sample
- MBA504 Introduction to Data Analytics for Business Case Study 1 Sample
- PRJ5004 QRP Management Plan Report Sample
- WELF1014 Human Service Provision Essay Sample
- HI6008 Business Research Project Report Sample
- MIS605 Systems Analysis and Design Assignment 1 Sample
- MITS4001 Business Information Systems Case Study 3 Sample
- PBHL20001 Understanding Public Health Essay 3 Sample
- HCT343 Research Methods and Data Analysis Report Sample
- HCCSSD202 Diversity and Inclusion Case Study 3 Sample
- COIT20262 Advanced Network Security Report 2 Sample
- MGT610 Organisational Best Practice Case Study 2 Sample
- ACCG8048 Ethics Theory Essay Sample
- Group of People Holding Papers Discussing White Laptop White Background Sample
- BAO6504 Accounting For Management Report Sample
- MBA6103 Agile Methodology Research Report 2 Sample
- HA3011 Accounting Report Sample
- SWOT Analysis of Chanel No5 Perfume Marketing 4ps Report
- HI6035 IS Governance and Risk Case Study Sample
- MIS500 Foundations of Information Systems Report 1 Sample
- ETCH304 Diverse Literacy and Numeracy Learners Report 1 Sample
- EBP107 Evidence-Based Practice Essay 3 Sample
- ICT504 IT Project Management Report 2 Sample
- GDECE103 Language and Literacy in the Early Years Report 2 Sample
- MIS608 Agile Project Management Report 2 Sample
- HI5029 IS Project Management Report Sample
- SBM3204 Sustainability and Ethics Case Study Sample
- MIS604 Requirements Engineering Case Study 1 Sample
- MBIS5010 Professional Practice in Information Systems Essay 2 Sample
- HI6032 Leveraging IT for Business Advantage Report Sample
- TECH2200 IT Project Management Case Study 1 Sample
- MANM376 International Finance Project Report Sample
- OPS928 Logistics Systems Assignment Sample
- HM6007 Statistics for Business Decisions/Statistics for Managers Assignment Sample
- BUS2008 Strategic Planning Report Sample
- ACC4001 Accounting Principles and Practices Assignment Sample
- Information Security Assignment Sample
- MIS100 Information Systems Case Study 2 Sample
- MKT600 Situation Analysis Report 1 Sample
- ICT707 Data Science Practice Report 2 Sample
- MBA503 Operations Management and Decision-Making Models Report 3 Sample
- NURBN2026 Person Centered Nursing Sample
- MEM601 Engineering Sustainability Report Sample
- LB5230 Managing Strategic Resources and Operations Report 3 Sample
- MBA622 Comprehensive Healthcare Strategies Report 1 Sample
- MBA5008 Business Research Methods Report 2 Sample
- TECH1300 Information Systems in Business Case Study 2 Sample
- ENEG28001 Australian Engineering Practice Report 1 Sample
- MITS6004 Enterprise Systems Report 1 Sample
- BUS5PB Principles of Business Analytics Report 1 Sample
- Journal of Co-operative Organization and Management Sample
- DATA4700 Digital Marketing and Competitive Advantage Report 3 Sample
- MIT101 Introduction to Information Technology Report 3 Sample
- MIS610 Advanced Professional Practice Report 2 Sample
- HM5003 Economics for Managers Assignment Sample
- PROJ6000 Principles of Project Management Report Sample
- Recovery Nursing Care Plan Case Study Sample
- BSBOPS601 Develop and Implement Business Plan Diploma Sample
- MIS500 Foundations of Information Systems Report Sample
- NURBN3031 Teaching, Learning and Situational Leadership for Health Practice Sample
- MIS775 Decision Modelling for Business Analytics Report Sample
- MEM601 Engineering Sustainability Case Study 3 Sample
- MBA641 Strategic Project Management Report Sample
- Planning in Health and Social Care Essay Sample
- ICT309 IT Governance Risk & Compliance Essay 2 Sample
- TECH2400 Introduction to Cyber Security Report 1 Sample
- MCR006 Financial Management Assignment 3 Sample
- COU101 Theories of Counselling Essay Sample
- NURBN2022 Case Study 3 Sample
- MBA501 Dynamic Strategy and Disruptive Innovation Case Study 1 Sample
- CHM108 Introduction to Business Law Report 1 Sample
- MIS605 Systems Analysis and Design Report 2 Sample
- MGMT6009 Managing People and Teams Report 1 Sample
- MBA404 Consumer Behaviour and Marketing Psychology Case Study 2 Sample
- ITW601 Information Technology – Work Integrated Learning Report 2 Sample
- CMT218 Data Visualisation Case Study Sample
- DATA4900 Innovation and Creativity in Business Analytics Report 3 Sample
- TCHR5003 Principles and Practices in Early Childhood Education Assignment Sample
- MGNT803 Organisational Behaviuor and Management Report Sample
- OPS802 Operations Management Report 3 Sample
- OPS928 Logistics Systems Report 2 Sample
- PLM Principles of Logistics Management Report Sample
- MBA404 Consumer Behaviour and Marketing Psychology Report 1 Sample
- DSMG29001 Disaster Risk Reduction Report 2 Sample
- OB223 Organisational Behaviour Report Sample
- SAP103 Introduction to Welfare Law Report 2 Sample
- OPS928 Logistics Systems Assignment Sample
- MLC707 Business Law Assignment Sample
- MBA505 Business Psychology Coaching and Mentoring Report Sample
- MOB6110 Creating Entrepreneurial Leaders Report Sample
- CSE2AIF/CSE4002 Artificial Intelligence Fundamentals Report Sample
- HI6008 Business Research Report Sample
- ENEG11005 Introduction To Contemporary Engineering Report Sample
- MGT601 Dynamic Leadership Report 1 Sample
- MBA6204 Quantitative Support of Decision Making Report 3 Sample
- WPDD202 Webpage Design and Development Report 4 Sample
- PPMP20009 Control Charts and Process Mapping Assignment Sample
- MIS603 Microservices Architecture Report 3 Sample
- BUMGT6928 Developing Leader in Global Context Essay 3 Sample
- TECH2100 Introduction to Information Networks Report 2 Sample
- DATA4900 Innovation and Creativity in Business Analytics Report 4 Sample
- MCR003 Management Attributes and Skills Report Sample
- NURBN1012 Legal & Ethical Decision Making in Person Centred Care Sample
- BE969 Research Methods in Management and Marketing Sample
- MGT604 Strategic Management Report 3 Sample
- BE485 Management and Strategy Report Sample
- DATA4400 Data-driven Decision Making and Forecasting Report 3 Sample
- MBA633 Real-world Business Analytics and Management Report 2 Sample
- ECUR207 Early Childhood Teacher Report Sample
- DATA6000 Capstone Industry Case Studies Sample
- Economics for Business Assignment Sample
- DATA4500 Social Media Analytics Case Study Sample
- MIS604 Requirement Engineering Report 1 Sample
- MIS609 Data Management and Analytics Case Study 1 Sample
- MG304 Agriculture Value Chain Management Case Study 2 Sample
- MGT607 Innovation, Creativity & Entrepreneurship Case Study Assignment Sample
- CAP203 Care of The Person With An Acute Illness Report 4 Sample
- MIS610 Advanced Professional Practice Report 2 Sample
- SITHCC001 Use Food Preparation Equipment Assignment 2 Sample
- CM801 Introduction to Risk Analysis Report 2 Sample
- COIT20252 Business Process Management Report 3 Sample
- ADM80001 Nanofabrication Technologies Report Sample
- TCHR2003 Curriculum Studies in Early Childhood Education Report 2 Sample
- HCCSSD103 Mental Health Case Study 3 Sample
- MGT613 Leadership for Sustainable Futures Report Sample
- BIZZ201 Accounting for Decision Making Report Sample
- PPMP20009 Case Study Sample
- ACCY801 Accounting and Financial Management Report 2 Sample
- MBA402 Governance, Ethics and Sustainability Report 3 Sample
- MK101 Marketing Foundations Report Sample
- 6006MHR Project Management Report Sample
- COIT20249 Professional Skills in Information Communication Technology Report 2 Sample
- TECH8000 IT Capstone Report Sample
- EDU40002 Play and Environment Report 2 Sample
- MBA402 Governance, Ethics and Sustainability Report 3 Sample
- BUS107 Business Ethics Report 3 Sample
- COU202 Counselling Theory and Practice Task 4 Report Sample
- MBA5008 Business Research Methods Case Study 3 Sample
- ICT707 Data Science Practice Report Sample
- MBA602 Small Business Administration Case Study 2 Sample
- BIS3006 IS Capstone Industry Project B Report Sample
- Child Development Case Study Sample
- MITS5004 IT Security Research Report 2 Sample
- TCHR3001 Early Childhood Matters Report 2 Sample
- ECON20039 Economics for Managers Report 2 Sample
- ISY503 Intelligent Systems Report Sample
- BUS5003 Information Systems and Data Analysis Case Study 2 Sample
- MIS608 Agile Project Management Report 4 Sample
- PRJ5105 Project Integration and Change Management Report 3 Sample
- BE489 Analysing Organizations in the International Report Sample
- TECH4100 UX and Design Thinking Report 2 Sample
- TECH1400 Database Design and Management Case Study Sample
- PSYC20039 Interdisciplinary and Cross-Cultural Approaches to Wellbeing Report Sample
- BUECO5903 Business Economics Assignment Part B Assignment Sample
- ECOM4000 Economics Report 3 Sample
- ENEG11005 Introduction to Contemporary Engineering Report Sample
- ECON7200 Economic Principles Report Sample
- DATA6000 Capstone: Industry Case Studies Report Sample
- ENGIN5210 Engineering Project Execution Research Report 1 Sample
- MBA643 Project Initiation, Planning and Execution Report Sample
- HI6032 Leveraging IT for Business Advantage Report 1 Sample
- DATA4000 Introduction to Business Analytics Report 3
- BUS2003 Data Engineering & Python Report 1 Sample
- PPMP20008 Initiating and Planning Projects Report 3 Part B Sample
- MBIS4009 Professional Practice in Information Systems Essay Sample
- NURS2021 Dimensions of Physical and Mental Health Case Study 3 Sample
- ENEM20002 Fluid Power Engineering and Control Report Sample
- MBA633 Real-world Business Analytics and Management Case Study Sample
- BUS5DWR Data Wrangling and R Report 3 Sample
- NRSG7377 Transition To Contemporary Nursing and Clinical Leadership Report 2 Sample
- ACCM4400 Auditing and Assurance Report Sample
- MBA6201 Quality Management Essay Sample
- MBA504 Introduction to Data Analytics for Business Report 3 Sample
- MBA404 Consumer Behaviour and Marketing Psychology Report 3 Sample
- MN7001 Summative Assessment 2 Report Sample
- BPM Final Assignment Sample
- TECH2200 IT Project Management Case Study Sample
- MBIS5014 Leading People in Digital Organisation Report 2 Sample
- MBIS5013 Sustainability and Enterprise 4.0 Report 2 Sample
- ECX2953/ECX5953 Economics Essay Sample
- DATA4000 Introduction to Business Analytics Case Study 1 Sample
- COS80025 Data Visualisation Report Sample
- HEAL5004 Strategic and Operational Health Services Management Report 3 Sample
- DSMG2002 Exploring Emergency in Disaster Management Research Report 1 Sample
- BUMGT6958 Comparative Issues in International Management Essay 1 Sample
- BUS101 Business Communication Essay 3 Sample
- MBA631 Digital Marketing and Communication Report 1 Sample
- TECH3200 Artificial Intelligence and Machine Learning in IT Report 3 Sample
- EASC2702 Global Climate Change Report Sample
- MBIS4008 Business Process Management Report 2A Sample
- Business Management Report Sample
- MCR001 Economics Case Study Sample
- SBU718 Strategic Leadership and Change Report 1 Sample
- AHS205 The Australian Healthcare System within a Global Context Report 2 Sample
- MBA6204 Quantitative Support of Decision Making Report 2 Sample
- MKTG6002 Marketing Report 3 Sample
- MIS608 Agile Project Management Report 1 Sample
- HI6036 IS Strategy and Innovation Case Study Sample
- HDW204 Healthcare in the Digital World Report 1 Sample
- MBA402 Governance, Ethics, and Sustainability 3B Report
- MGT605 Business Capstone Project Report 1 Sample
- ENGR8931 Geotechnical Engineering GE 1st Copy Sample
- PRJ6001 Applied Project Report 1 Sample
- HI5004 Marketing Management Assignment Sample
- OMGT2327 Distribution and Freight Logistics Case Study 1 Sample
- NURBN2023 Pathophysiology and Pharmacology Applied to Person-Centred Nursing Essay Sample
- HT5005 Working as an Early Childhood Professional Essay Sample
- LB5230 Managing Strategic Resources and Operations Report 2 Sample
- ACF5956 Advanced Financial Accounting Report Sample
- ACCT6006 Auditing Theory and Practice Case Study Sample
- CISM4000 Information Systems in Accounting Report 3 Sample
- COIT20253 Business Intelligence using Big Data Report Sample
- AM906002 Corporate Governance Case Study 2 Sample
- TO5103 Global Destination Competitiveness Report Sample
- MIS611 Information Systems Capstone Report 1 Sample
- M20467 Strategic Management Coursework Sample
- DATA4000 Introduction to Business Analytics Case Study 1 Sample
- ACC602 Financial Accounting and Reporting Report 4 Sample
- MGT502 Business Communication Report 1B Sample
- FIN311 Agricultural Accounting and Business Law Part A Report Sample
- SAP102 Welfare Systems and Services in Australia Report 1 Sample
- ICC104 Introduction to Cloud Computing Report 3 Sample
- MIS608 Agile Project Management Report 2 Sample
- DATA4000 Introduction to Business Analytics Report 3 Sample
- ECE306 Trauma Sensitive Practice and Well-being Report Sample
- AC400 Agribusiness Accounting Report 2 Sample
- Critically Examine and Identify the Issues within The Case Study from a Legal and Ethical Perspectiv
- Organisational Behaviour (OB) Essay Sample
- MBA5004 Managing Decision Making Process Report 2 Sample
- MBA642 Project Initiation, Planning and Execution Report Sample
- MN7002 International Business Strategy Report Sample
- BSBPMG535 Manage Project Information and Communication Business Documents Diploma Sample
- MBA621 Healthcare Systems Case Study 2 Sample
- NUR131 Research Foundations for Health Practice Case Study 2 Sample
- MBA7069 Leadership and Management Report Sample
- M33117 Public Policies and Labour Markets Report Sample
- GDECE104 Professional Teaching Practice 1 Report 2 Sample
- Australian Migration Law Assignment Sample
- MBA401 People, Culture and Contemporary Leadership Report Sample
- Information Security PG Assignment Sample
- M5011 Accounting for Management Report Sample
- MIS610 Advanced Professional Practice Report 3 Part A Sample
- MBA673 Business Analytics Life Cycle Report 2 Sample
- MBIS5012 Strategic Information Systems Report Sample
- FINM4100 Analytics in Accounting, Finance and Economics Report 2 Sample
- MGT502 Business Communication Report 2 Sample
- Principles of Supply Chain Management Report Sample
- AT3 Nursing Case Study Sample
- HNO6010 Recovery-Oriented Mental Health Research Report 2 Sample
- BULAW5915 Corporate Law Assignment Sample
- Enem28001 fea for engineering design report sample
- MC7080 Digital Marketing & Social Media Report Sample
- ICT80011/40005 Energy Storage System Report Sample
- NURBN1016 Primary Health Essay 2 Sample
- Health and Social Care in Emergencies and Disasters Report 3 Sample
- ADM80012 Technology Management Report 2 Sample
- TUM202 Therapeutic use of Medicines Report 2 Sample
- CS4417 Software Security Report Sample
- DATA4200 Data Acquisition and Management Report 1 Sample
- EC102 Agricultural Economics Assignment Sample
- BRM5002 Intercultural Awarness for Business Report Sample
- PRJ5108 Project Delivery and Procurement Case Study 4 Sample
- Clinical Governance Essay 1 Sample
- MGT600 Management People and Teams Report 1 Sample
- SOAD8014 Introduction to Australian Health and Human Services Essay 2 Sample
- HCCSSD102 Person Centred Practice Report 1 Sample
- MBIS5010 Professional Practice in Information Systems Case Study 3 Sample
- HNO6008 Mental Health Nursing Report 3 Sample
- TECH2100 Introduction to Information Networks Report 3 Sample
- CAO107 Computer Architecture & Operating Systems Report 2 Sample
- MANM399 International Accounting and Finance Project Report Sample
- MBA404 Consumer Behaviour and Marketing Psychology Report Sample
- 7318AFE Business Data Analytics Report 2 Sample
- TCHR2002 Children, Families & Communities Report 1 Sample
- FIN600 Financial Management Case Study Sample
- EDU30059 Teaching Technologies Report 2 Sample
- REM502 Research Methodologies Research Report 3 Sample
- INFS5023 Information Systems for Business Case Study Sample
- MITS5502 Developing Enterprise Systems Report Sample
- LB5403 Project Management Principles and Foundations Case Study 1 Sample
- MN691 Research Methods and Project Design Report Sample
- MBA613 Organisational Change and Innovation Case Study 3 Sample
- MCR007 Understanding Project Management Essay 1 Sample
- BIZ102 Understanding People and Organisations Report 3 Sample
- MEM603 Engineering Strategy Report 2 Sample
- MIS605 Systems Analysis and Design Report Sample
- CAP203 Care of the person with an acute illness Case Study 2 Sample
- EC400 Agribusiness Economics and Finance Case Study 3 Sample
- MGT602 Business Decision Analytics Report Sample
- PRJ5106 Research Methodology and Data Analysis Report 4 Sample
- INFS2036 Business Intelligence Report 1 Sample
- MG301 Agriculture and Resource Policy Case Study Sample
- Investigating The Issue of Inequality in Workplaces Essay Sample
- MITS6002 Business Analytics Research Report Sample
- PRJ5001 Project Management Profession Report Sample
- HI6037 Business Analytics Fundamentals Assignment Sample
- FIT5057 Project Management Case Study 1 Sample
- HI5033 Database System Report Sample
- MBA401 People, Culture and Contemporary Leadership Report 3 Sample
- LB5231 Corporate Responsibility and Governance Report 2 Sample
- TECH2300 Service and Operations Management in IT Report 3 Sample
- OPS909 Total Quality Management Report 1 Sample
- BST714 Strategic and Operational Decision-Making Assignment Sample
- LB5234 Leading and Managing Organizational Change Report 2 Sample
- INT101 Introduction to International Relations and Politics Essay Sample

 81 Isla Avenue Glenroy, Mel, VIC, 3046 AU


